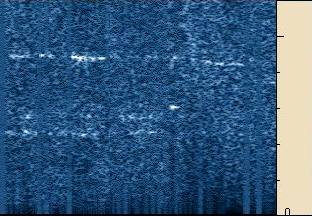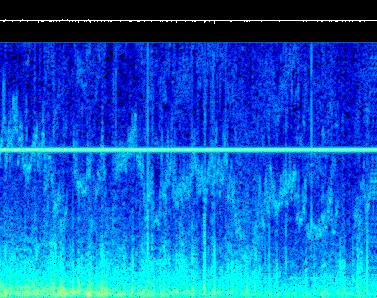
Received with Horizontal loop of 2100 square meters, Marconi T antenna (11m high, 45m top) and earth dipole of 70m (North/South oriented). Analyzed with Spectrogram and Spectran.
061199-1256
Spectrogram of 20', in 0-86
Hz band.
Strong noise below 15 Hz and strange variable signal, started from 70 Hz (left) to 25 Hz (right). Probably caused by electrostatic activity during a storm. |
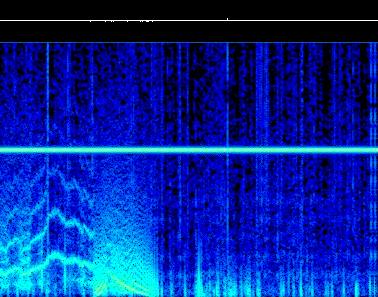
071199-0432
Spectrogram of 20', in 0-86
Hz band.
Strange variable signal, like a 3 mountain pitch. All below 50 Hz main power. Probably caused by electrostatic activity during a storm. Weak Schumann resonances on background. |
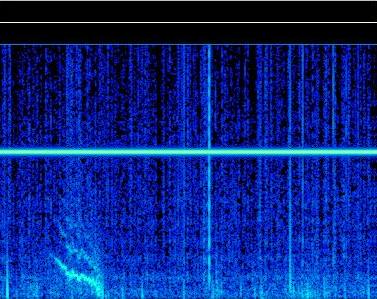
071199-0519v
Spectrogram of 20', in 0-86
Hz band.
Strange variable signal, similar to upper. All below 50 Hz main power. Probably caused by electrostatic activity during a storm. Schumann resonances on background |
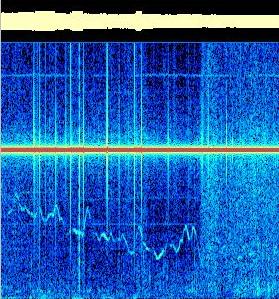
091299-1845
Spectrogram of 20', in 0-86
Hz band.
Continuous 75 Hz tone, and variable tone starting from 35 Hz (left) to 15 Hz (right). |
170300-1432
Spectrogram of 30', in 0-13
Hz band.
Variable noise at 2.5 Hz, 4.3 and 5 Hz. |
170300-2235
Spectrogram of 30', in 0-13
Hz band.
Clear the 1st. Schumann resonance, at 7.8 Hz. Some noise at 1 Hz. |
050200-0009
Spectrogram of 30', in 0-6
Hz band.
No signal below 1 Hz; two weak and variable tones at 2.2 Hz (15 min. long) and 4.3 Hz (about 25 min.). |
180300-0908
Spectrogram of 30', in 0-13
Hz band.
Strong noise below 3 Hz, with maximum at 1 Hz and 2.2 Hz. Weak tone at 9.7 Hz and 5.8 Hz. |
180300-1108v
Spectrogram of 30', in 0-13
Hz band.
Strong noise below 3 Hz, with maximum at 1 Hz. |