I am 38 years old and I
reside in Athens, Greece. My major is electronic engineering.
Since 1991, I have been involved as an amateur - in monitoring and recording
the magnetic field variations, aiming to trace earthquake precursors.
For this purpose, I have constructed and tested many different circuits
and sensors. It is a fact that the major problem during measurements is
created by the use itself of electric devices, as well as the power lines.
Scope of Measurement
During the past few years, I have focused my study
on 0,1 Hz to 40 Hz frequency spectrum, measuring and recording the instant
variations of the magnetic field and not its absolute value.
Unfortunately, in the vicinity of big cities, the
levels of signals from natural sources are 1.000-30.000 times lower than
those of signals transmitted by our technological civilization. For
this reason, the use of filters in the electronic circuit is imperative.
The Electronic Circuit
The electronic circuit diagram can be seen on Picture
1 and Picture 2.
It consists of amplifying stages and electronic
frequency filters.
Its first stage consists of the operational amplifier LT1128. The alternative voltage (in the 50Hz frequency) of the LT1128 Pin 6 should not exceed +-2V (in reference to ground); alternatively, we reduce the value of R1.
The second stage is a filter Notch in the frequency of 50Hz and consists of two OP27.
The three variable resistors of the filter are 20-turns trimmers, adjusted to the values specified on the diagram, before placed on the circuit. When the circuit is in operation measuring the magnetic field, the trimmers are readjusted micro metrically on the original values, in order to achieve the lowest AC voltage in the frequency of 50Hz, at the circuit output.
From trimmer R2, we should have 0 V DC at the circuit output, while from the trimmer of the output stage, we adjust the value of the output signal which we forward to the Line-In of our computer sound card.
The capacitors C1, C2, C3, C4 are of Silver mica or foil polystyrene type in order to maintain stable capacity during temperature variations.
All stable resistances are of metal film 1% type.
Having tested many different operational amplifiers combinations, I decided on the ones of the diagram since they offer lower noise levels and better overall performance on the specific circuit.
The Sensor
The sensor consists of a 50cm long PVC pipe, with
5cm external diameter. We wrap three layers of 0.04 MuMetal sheet around
the pipe. Over the MuMetal, we wrap insulating tape and coil enamel coating
wire, 1 mm thick, at pipe's length. We coil ~9 layers of wire (~ 4.500
coils). When the coil is completed, we wrap it up with insulating tape
and plate it with aluminum foil or self-adhesive aluminum tape. The
aluminum is connected to the plate of the coaxial cable (RG-213, RG-8
)
that we use as signal transfer line.
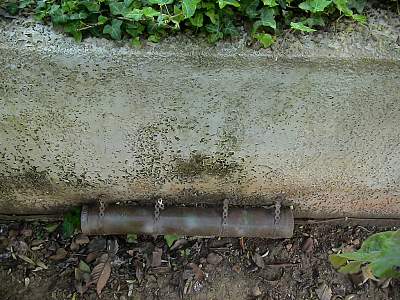 |
The end of the external winding of the coil is
also connected to the shield of the cable, while the internal end is connected
to the internal conductor of the coaxial cable. The coil in inserted into
a 60cm long PVC pipe, with 10cm diameter it is then stabilized and waterproofed.
The coil has pure resistance R = 16 Ohm and self-induction L = 1 H. The final construction is placed horizontally 10cm above the ground and stabilized. The ends of the coil are adjusted at 110o and 290o respectively in reference to the magnetic north. . |
Just to emphasize that the coil should have low pure resistance (including the coaxial cable), in order to achieve reduced noise in the circuit
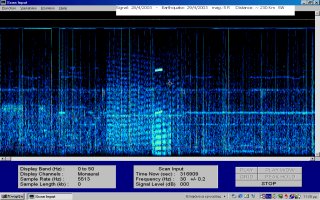
Recording Software
For the recording, I use the spectrogram with the following settings:
In order to save the images, I use program 2020
with the following settings:
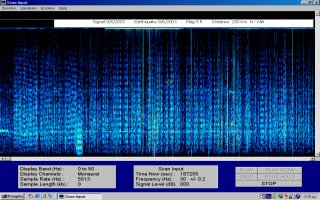
Receiving Samples
28_4_2003
Record
Quake 29_4_2003, 5R 230km SW |
8_6_2003
Record
Quake 9_6_2003, 5R 230km NNW |
|
|
|
|
|
6_7_2003
Record
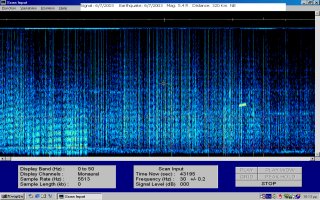
Quake 6_7_2003, 5.4R 320km NE |
13_8_2003
Record
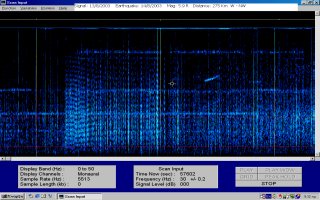
Quake 14_8_2003, 5.9R 275km WNW |
|
|
|
|
|
8_2_2004
Record
Quake 9_2_2004, 4.6R 250km SW |
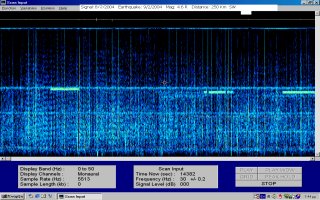
29_2_2004
Record
Quake 1_3_2004, 5R 175km SW |
|
|
|
|
|
07_3_2004
Record
Quake 11_3_2004, 4.5R Dodecanese Isl |
14_3_2004
Record
Quake 17_3_2004, 6.1R South of Crete Isl |
Findings
I have already completed an analysis of the records produced during the period from 01-02-2003 to 01-03-2004. (During that period, the reception/ recording device has been unavailable for a total of 30 days due to technical reasons.)
According to Athens National Observatory, 12 earthquakes of 4,8R or above have been recorded for the same period. (Aftershocks that follow bigger earthquakes within a few days are excluded; earthquakes that occurred the days from 23-07-2003 till 26-07-2003 are also not recorded due to technical problem.)
Analyzing the remaining 10 earthquakes in relation to the registered precursors, we can draw the following conclusions:
1. The time of precursor occurrence is somehow related to the positions of the Sun and the Moon in relation to Earth and the gravitational powers generated. A signal possibly related to a forthcoming earthquake is twice as likely to appear within 72 hours after the actual time of each phase of the Moon (new moon, first quarter, full moon, last quarter), than within the 72 hours before.
2. The average time of occurrence is app. 1 hour before sunset
3. 75% of the earthquakes following the precursors
occur within 72 hours after the precursors
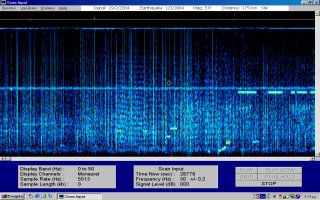
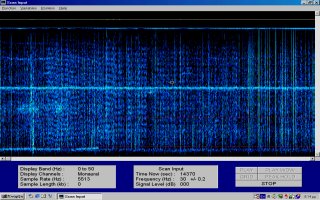
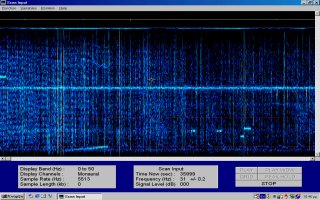
Earthquake Precursors Pattern
The pattern of earthquake precursors could be described as pre-earthquake signature since every reoccurrence maintains common characteristics. Observing the recorded signal, one realizes that, throughout the spectrum 1-40Hz, there are lines almost parallel to each other at any given time. Any spectral line differs 1-3Hz from the previous one.
The duration of the pre-earthquake signature varies from 15 minutes up to 3 hours, while for the specific spectral impressions, the intensity of the magnetic field varies from 2 PT to ~20 PT. It is most likely that the common characteristics of the signal will still appear in frequencies higher than 40 Hz. Further observation is required in order to verify the following:
What is the correlation of the magnetic field intensity
and the duration of the pre-earthquake signature with the data of the
earthquake to follow?
What is the highest frequency in which the pre-earthquake
signature is observed, as well as the correlation of the frequency with
the earthquake magnitude or the distance from the epicenter to the reception
device?
Conclusion
The intensity of the earthquake precursor will be
increasing as one approach the epicenter of the imminent earthquake.
Consequently, earthquake prediction through the method described above
requires a network of base-stations throughout the country, each station
including at least two sensor devices and the respective recording equipment.
I believe that observation of the earthquake signature
used in parallel with other methods can provide very satisfactory results
in earthquake prediction.
Teamwork, selfless interest and publication of
the progress and research findings of different scientific groups are the
prerequisites for successful earthquake prediction. Selfish motives
can only cause further delay to a possible solution, which means more death
and tragedy
.
I hope that soon all scientists working in the
specific field will cooperate and combine their knowledge in order to achieve
a common goal, earthquake prediction, which is essential to humanity.
In the future, pre-earthquake signatures will
be posted in this site, as soon as possible following occurrence.
We are always at your disposal to provide further
clarifications and data to anyone interested in constructing the specific
device. More detailed pictures are available at my web site: http://www.ham.gr/ulf/index_en.php