A measuring system for recording and monitoring magnetic field at industrial frequency due to human activity
by Luca Feletti
0 – ABSTRACT
In this article we intend to describe the prototype of a measuring and monitoring instrument for the magnetic field at low frequency whose origin is not natural but caused by human activity, with particular interest in industrial frequency (50 or 60 Hz) and its harmonics.
The field sources of this magnetic field are part of our everyday life (electric motors and electrical machines in general) and also part of the landscape in which we live (power transmission and distribution lines in high, middle or low voltage).
Most countries have developed laws for the protection of the population against the health effects due to the exposure to electromagnetic fields, showing how the problem should not create alarmism, but requires to be dealt with seriously and with a scientific approach. Also at the basis of this study is the desire to assess objectively, through appropriate measures and monitoring, the level of exposure to low frequency magnetic field for the population that spends most part of the day in a given place.
The magnetic field in which we are interested is a vector entity, in general time-varying both in intensity and in direction.
The instrument which we shall describe is capable of measuring the intensity of the three spatial components of the magnetic field with which we can, instant by instant, reconstruct the complete definition of the vector.
The measure technique uses both hardware, for the signal acquisition, (triaxial probe, filters and amplifiers), and software, for signal recording and analisys (for example the excellent Spectrum Lab).
With the instrument described below, we shall have a measurement station useful to monitor a given site for the time necessary to characterize it with reference to the magnetic field.
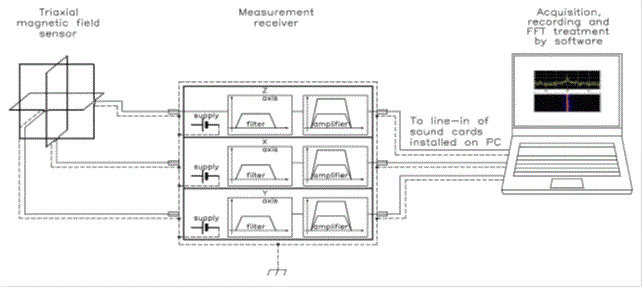
Although the measurement set-up is a triaxial system, we shall describe only one of the three axes, because the other two behave in the same way.
In this article we intend to describe the prototype of a measuring and monitoring instrument for the magnetic field at low frequency whose origin is not natural but caused by human activity, with particular interest in industrial frequency (50 or 60 Hz) and its harmonics.
The field sources of this magnetic field are part of our everyday life (electric motors and electrical machines in general) and also part of the landscape in which we live (power transmission and distribution lines in high, middle or low voltage).
Most countries have developed laws for the protection of the population against the health effects due to the exposure to electromagnetic fields, showing how the problem should not create alarmism, but requires to be dealt with seriously and with a scientific approach. Also at the basis of this study is the desire to assess objectively, through appropriate measures and monitoring, the level of exposure to low frequency magnetic field for the population that spends most part of the day in a given place.
The magnetic field in which we are interested is a vector entity, in general time-varying both in intensity and in direction.
The instrument which we shall describe is capable of measuring the intensity of the three spatial components of the magnetic field with which we can, instant by instant, reconstruct the complete definition of the vector.
The measure technique uses both hardware, for the signal acquisition, (triaxial probe, filters and amplifiers), and software, for signal recording and analisys (for example the excellent Spectrum Lab).
With the instrument described below, we shall have a measurement station useful to monitor a given site for the time necessary to characterize it with reference to the magnetic field.

Fig. 0-1 block diagram of measurement set-up
Although the measurement set-up is a triaxial system, we shall describe only one of the three axes, because the other two behave in the same way.
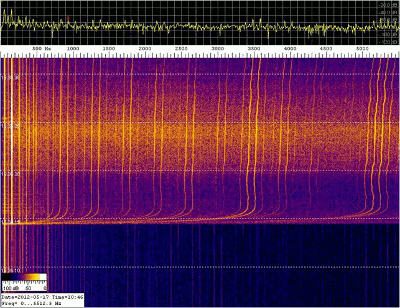 Fig. 0-2 a spectrogram obtained using Spectrum Lab |
The measurement set-up in fig. 0-1 can acquire and record (on three separate channels) spectrograms (fig. 0-2) representative of the spatial components of the magnetic field vector in the frequency range from 5 Hz to 10 kHz and the software used allows a spectral analysis on the data recorded. Finally, only a note about the bibliographic references: they are listed at the end of the article in square brackets and this notation is used throughout the article as well. |
1 – THE STARTING IDEA
The
basic idea of the present study (later developed in the
course of the work, embracing other aspects too) was
related to the need to validate, with measurements, some
simulations of magnetic field generated by electrical
lines. These simulations are required both in the
case of new plant and, for example, in the case of
evaluation of the distance from existing installations or
again when we want to evaluate the effect obtained as a
result of a shielding action of the magnetic field.
All the simulations are based on mathematical models with different degree of accuracy according to the precision required from the results or to the complexity of the real system.
The increasing sophistication of the model also increases the complexity of the necessary calculations.
In some cases, the real problem is so complex that it is not possible to carry out an analytical description using elementary functions, while only a numerical evaluation is possible, obtained, for example, with finite elements computation techniques (FEM analysis).
Often, however, it’s essential to make a measurement of realty, for example to evaluate the error made by using a specific model and to know its entity for future applications.
Now we will analyze two cases: an analytical model used for the evaluation of the magnetic induction generated by an electric aerial line at ground level and a numerical model used to study the magnetic field within and around a conductors system in which a given current flows.
1.1 – Analytical approach
The system we have to consider for this example
is a three-phase electric aerial line at middle voltage
(20 kV) operating at 50 Hz (sinusoidal). This line
represents a real case of study and fig. 1.1-1
illustrates it.
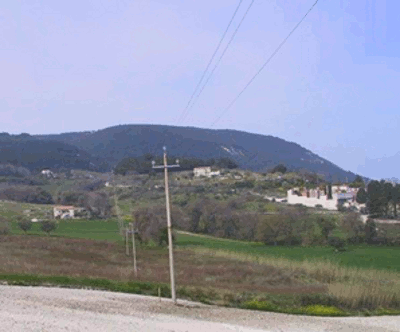 Fig. 1.1-1 middle voltage (20 kV) three-phase electrical aerial line (Sirolo - Ancona - Italy) |
The main characteristics (and approximations) of the model used for the study of the magnetic field generated by this line are the following: • all the conductors of the line are rectilinear, horizontal, with infinite length and parallel to each other; • the cross-section of the conductors is circular with constant diameter; • voltage and current vector are in phase; • the electrical charge on the surface of the conductors has uniform distribution; • the ground is considered to be flat, perfect electric conductor and magnetically transparent; • all the objects around the line are neglected. |
A uniform distribution of electric charge on
the surface of the conductors is a realistic hypothesis
when the diameter of the conductors is small in
comparison to the distance between conductors at
different potential.
With the hypothesis listed above, we can reduce this problem (typically three-dimensional) to a two-dimensional case, with the possibility to study it in an x-y plane, regardless of the z coordinate (parallel to the axis of the conductors).
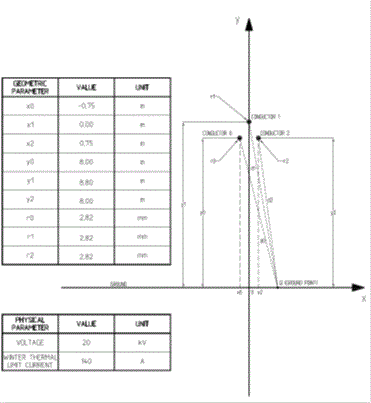
Fig. 1.1-2 shows the geometric model with the physical parameters of the line.
At the basis of the calculation there are considerations of the physical phenomenon related to the production of a magnetic field by an electric current and an interesting analogy between electric field and magnetic field, as reported briefly in the following frame.

Now, with a little math, we can obtain the expression of the induction generated in the space by a rectilinear conductor in which a given electrical current flows, as shown below.
With the hypothesis listed above, we can reduce this problem (typically three-dimensional) to a two-dimensional case, with the possibility to study it in an x-y plane, regardless of the z coordinate (parallel to the axis of the conductors).
Fig. 1.1-2 shows the geometric model with the physical parameters of the line.

Fig. 1.1-2 geometric model
At the basis of the calculation there are considerations of the physical phenomenon related to the production of a magnetic field by an electric current and an interesting analogy between electric field and magnetic field, as reported briefly in the following frame.

Now, with a little math, we can obtain the expression of the induction generated in the space by a rectilinear conductor in which a given electrical current flows, as shown below.

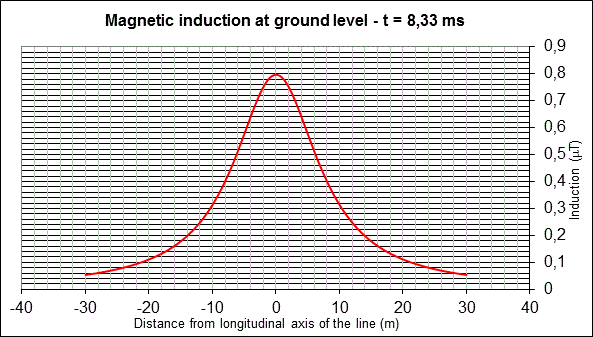 Fig. 1.1-3 magnetic induction at ground level |
In our case, we can use Biot and Savart’s law for the calculation of the induction value in proximity of the electric line considering three conductors in which a three-phase sinusoidal (50 Hz) current system flows with RMS value equal to the winter thermal limit of the line (40 A in the example). Varying the distance from the longitudinal axis of the line, we obtain the distribution of induction shown in the diagram of fig. 1.1-3. |
1.2 –
Numerical approach
Let’s suppose, now, that we want to evaluate the distribution of magnetic field within and around a conductors system in which a given current flows.
The currents are generated by a three-phase power supply connected to a balanced load.
Fig. 1.2-1 shows the parameters of the system we want to study.
Without going too much into the use of the software (for this aspect you can refer to the bibliography [2]), it is necessary to introduce these pieces of information in the definition of the problem:
• geometric data (we can consider only a cross section of the line, reducing the real three-dimensional
problem to a two-dimensional case with translation of the section along a third axis);
• material properties;
• field sources (in our case the currents flowing into the conductors);
• boundary conditions.
Then we must define the mesh of finite elements necessary to cover the areas in which we have defined our problem.
Finally, using the capabilities of the software, we can obtain the solution of Maxwell’s equations for our problem and, then, with a post-processing, visualize interesting information.
Fig. 1.2-2 represents the mesh for the problem and Fig. 1.2-3 shows the graphical representation of the magnetic field distribution (due to the electric currents) within and around the conductors system.
Let’s suppose, now, that we want to evaluate the distribution of magnetic field within and around a conductors system in which a given current flows.
The currents are generated by a three-phase power supply connected to a balanced load.
Fig. 1.2-1 shows the parameters of the system we want to study.
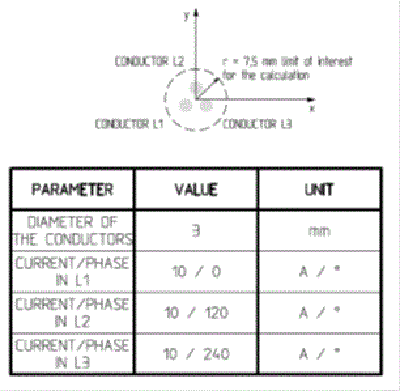 Fig. 1.2-1 geometric model |
This time we want to use a numerical
approach for the solution of the problem,
because we are not interested in an analytical
expression with which to describe the magnetic
field in the space, but we are interested in its
numerical values and, possibly, in a graphical
representation of the results.
To achieve this goal, some software based on finite element analysis (FEM) may be useful. For example we used QuickField 5.9 (in its Student version, free downloadable from internet [1]). This software solves Maxwell’s equations and gives results of the analysis both in graphical and tabular format. |
Without going too much into the use of the software (for this aspect you can refer to the bibliography [2]), it is necessary to introduce these pieces of information in the definition of the problem:
• geometric data (we can consider only a cross section of the line, reducing the real three-dimensional
problem to a two-dimensional case with translation of the section along a third axis);
• material properties;
• field sources (in our case the currents flowing into the conductors);
• boundary conditions.
Then we must define the mesh of finite elements necessary to cover the areas in which we have defined our problem.
Finally, using the capabilities of the software, we can obtain the solution of Maxwell’s equations for our problem and, then, with a post-processing, visualize interesting information.
Fig. 1.2-2 represents the mesh for the problem and Fig. 1.2-3 shows the graphical representation of the magnetic field distribution (due to the electric currents) within and around the conductors system.
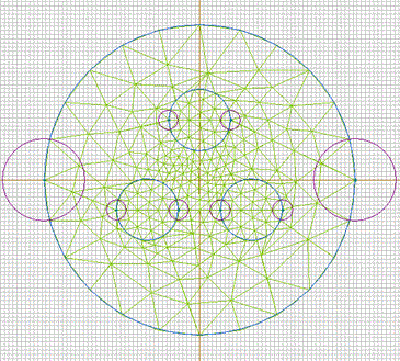 Fig. 1.2-2 mesh definition |
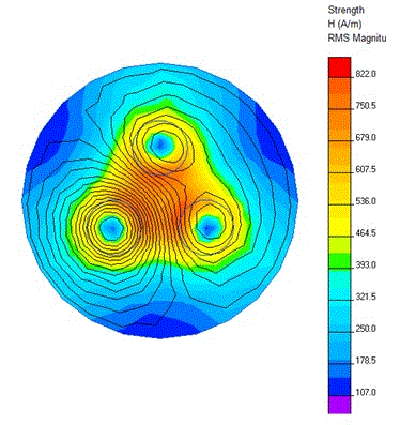 Fig. 1.2-3 representation of the magnetic field distribution |
Obviously,
much more information may be represented, for example:
magnetic induction, energy density, current density, etc…
You can find more details about the finite element method in [7] of bibliography.
An example of induction field calculation within an MT / BT transformer substation is shown in [8].
1.3 – Validation and measuring
After a theoretical study, both with an analytical and a numeric approach, in the design or verification it is often necessary to make sure, using a measuring system, that what has been "calculated" is actually representative of reality, or, better, it is necessary to know the error made by approximating reality with a mathematical model (of any type), to take it into account for future occurrences or change the model making it, where possible, more accurate.
Finally, today conducting environmental monitoring aimed at preventing risks from exposure to electromagnetic fields is growing in importance. Once again, in this case, it is important to make a measurement and to document the measuring process, with a clear exposition of the results and of all the information necessary to repeat the measure.
2 – THE SYSTEM DESIGNED
Now we shall describe the designed measuring system. For convenience, we shall make the description following the path of the signal we are interested in and we shall do that using the block diagram of Fig. 2.1. Each following chapter shall be relative to one of the blocks represented.
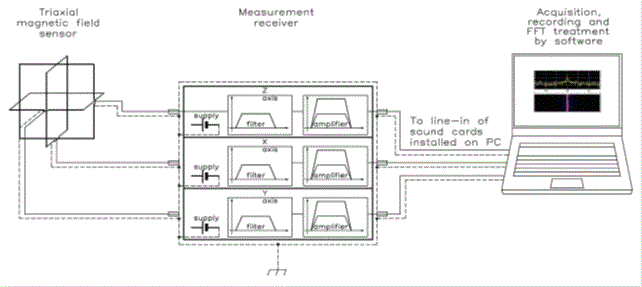
Although the measurement set-up is a triaxial system, we shall describe only one of the three axes, because the other two behave in the same manner.
Only the description of the magnetic field probe will be exposed with reference to all three axes, because we must describe also its construction features.
2.1 – Triaxial magnetic field probe
For a preliminary design, we started thinking about what we wanted to measure, namely a magnetic field of about a few tens of microtesla at the frequency of 50 Hz and its harmonics.
A compact and sufficiently robust probe would have been useful, able to provide, in correspondence of the above values of magnetic field, an open circuit voltage of the order of tens of millivolt.
At this regard, the studies reported in [3] and [4] have been very useful and they led us to consider as appropriate, in first approximation, a square loop of about 10 cm side with a thousand of turns.
A first sizing gave us this result, using the classical formulas invented in literature (see bibliography [3], [4] e [5]) for multi-layer square windings:
You can find more details about the finite element method in [7] of bibliography.
An example of induction field calculation within an MT / BT transformer substation is shown in [8].
1.3 – Validation and measuring
After a theoretical study, both with an analytical and a numeric approach, in the design or verification it is often necessary to make sure, using a measuring system, that what has been "calculated" is actually representative of reality, or, better, it is necessary to know the error made by approximating reality with a mathematical model (of any type), to take it into account for future occurrences or change the model making it, where possible, more accurate.
Finally, today conducting environmental monitoring aimed at preventing risks from exposure to electromagnetic fields is growing in importance. Once again, in this case, it is important to make a measurement and to document the measuring process, with a clear exposition of the results and of all the information necessary to repeat the measure.
2 – THE SYSTEM DESIGNED
Now we shall describe the designed measuring system. For convenience, we shall make the description following the path of the signal we are interested in and we shall do that using the block diagram of Fig. 2.1. Each following chapter shall be relative to one of the blocks represented.

Fig. 2-1 block diagram of
the designed measuring system
Although the measurement set-up is a triaxial system, we shall describe only one of the three axes, because the other two behave in the same manner.
Only the description of the magnetic field probe will be exposed with reference to all three axes, because we must describe also its construction features.
2.1 – Triaxial magnetic field probe
For a preliminary design, we started thinking about what we wanted to measure, namely a magnetic field of about a few tens of microtesla at the frequency of 50 Hz and its harmonics.
A compact and sufficiently robust probe would have been useful, able to provide, in correspondence of the above values of magnetic field, an open circuit voltage of the order of tens of millivolt.
At this regard, the studies reported in [3] and [4] have been very useful and they led us to consider as appropriate, in first approximation, a square loop of about 10 cm side with a thousand of turns.
A first sizing gave us this result, using the classical formulas invented in literature (see bibliography [3], [4] e [5]) for multi-layer square windings:
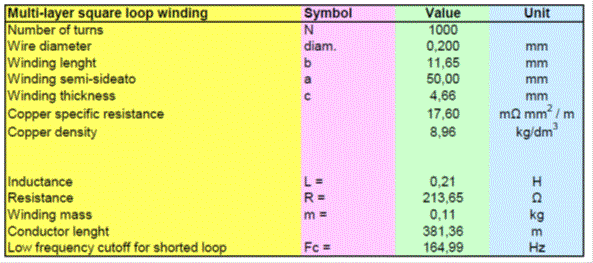

Reasoning about the reduction of the parasitic
capacitance, we decided to split the winding into four
sections with 250 turns (of the same copper wire) each
section.
This solution reduces also the inductance and, consequently, increases the low frequency cutoff, but we shall compensate this aspect in the circuit design for the block named measurement receiver.
With the same formulas already used, we have obtained, for the winding divided into four sections, the following results:
• resistance 213 Ω;
• inductance 52 mH.
After this preliminary analysis, because the results seemed suited to our needs, we started the construction of a prototype.
We first prepared the windings wood support, with mechanical data as showed in Fig. 2.1-1 and Fig. 2.1-2.
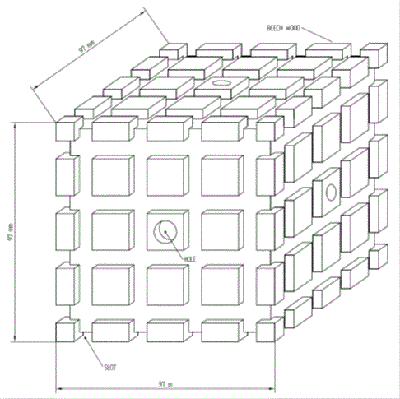 Fig. 2.1-1 winding wood support for the magnetic field probe |
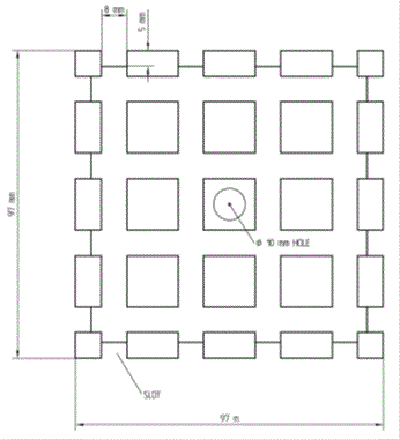 Fig. 2.1-2 front view of a face of the support |
Then, we realized the windings with following specifications:
• 1000 turns each axis, placed in four slots with 250 turns each;
• enameled copper wire with one strand of 0,2 mm diameter (0,233 mm external diameter);
• polyurethane insulation.
The following photos show the prototype.
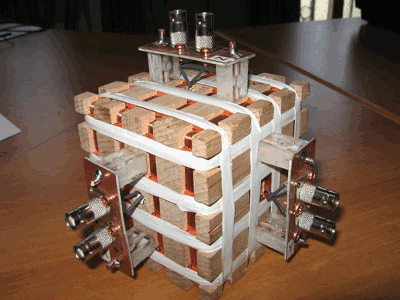 Fig. 2.1-3 triaxial magnetic field probe |
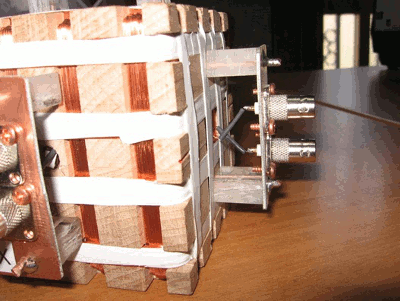 Fig. 2.1-4 BNC socket for each termination of the windings |
We
soldered all the terminations of the winding to the
central pole of a BNC socket. This solution allows us to
connect each axis of the probe to the measurement receiver
with a pair of shielded cables (the length is about 15 cm)
in order to prevent unwanted coupling.
Finally it can be noted that we did not use iron for fixing parts, but only copper for screws, and anchors.
On the prototype we performed many bench tests and the following tables show the results we obtained:
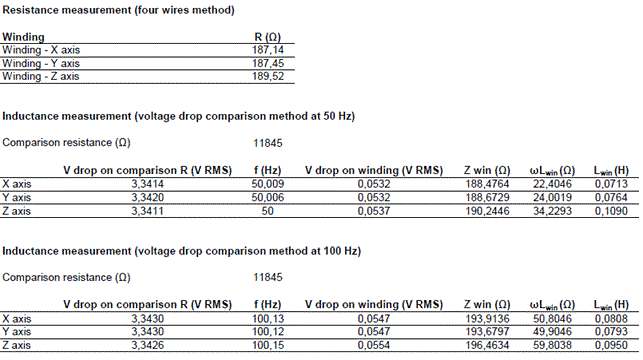
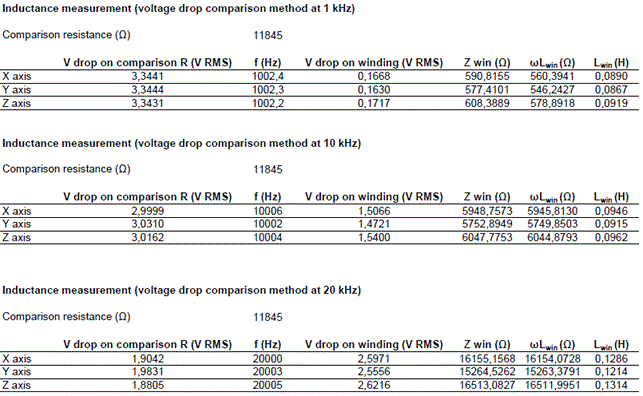
Subsequently we tested the windings with a RCL bridge and the results we obtained are shown below:


Finally we performed a test to identify the resonance frequency of the windings for the determination of the parasitic capacitance.
Using the inductance and resistance values showed in previous tables, we found the following results for the three axes of the winding:
X axis resonance frequency: 39,0 kHz parasitic capacitance: 184,5 pF
Y axis resonance frequency: 40,4 kHz parasitic capacitance: 176,5 pF
Z axis resonance frequency: 39,7 kHz parasitic capacitance: 170 pF
We then measured all the parameters of the probe and we can use them for subsequent circuit simulations.
The parameters that we inserted in the measurement receiver circuit model are the following:
Resistance: 190 Ω
Inductance: 89 mH
Parasitic capacitance: 185 pF
Cutoff low frequency (fc): 340 Hz.
3 – MEASUREMENT RECEIVER
Our interest is in magnetic field and so also the receiver will have to be sensitive to this field.
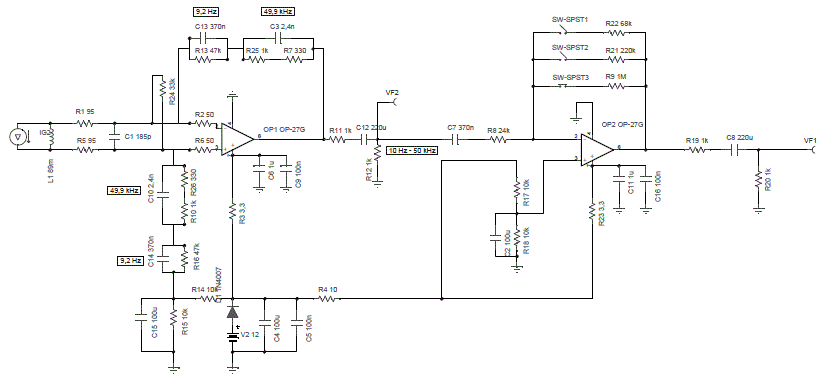
To reach our goal, we designed a two stage receiver. The first stage acquires the signal coming from the probe and operates on it a filtering operation and a first amplification. The second stage operates a final amplification with variable level by means of a switch.
The output of this stage is connected to the line input of the PC audio card.
The configuration of the operational amplifier offers a virtual short circuit to the signal coming from the probe so that the energy contained in the signal is transferred to the first stage of the receiver with virtually no loss.
In the reaction chain of the first stage we can see two RC cells that determine the pass-band.
The frequencies of the RC cells are 9,2 Hz and 49,9 kHz.
Remeber that the used probe (a small loop sensitive to the magnetic field) has two operating modes: resistive and reactive.
The transition from one mode to the other occurs in correspondence of the cutoff frequency (fc), defined as the frequency at which the resistance is equal to the inductive reactance.
Below fc the current in the loop increases with the frequency; above fc the current remains constant when the frequency increases.
The cell at 9,2 Hz introduces, in the reaction chain, a pole that makes the frequency response flat, compensating for the slope introduced by the probe below the cutoff frequency (resistive mode).
At fc, and above this frequency (where the probe works in reactive mode), the reactance of the capacitor (C13 in the scheme) is much smaller than the resistance (R13 in the scheme) and so only the resistive part of the second RC cell works introducing a flat amplification.
The cell at 49,9 kHz is a low-pass net which avoids the amplification of RF undesired signals and reduces the reaction impedance at high frequency so to prevent self-oscillations of the operational.
For more information about the magnetic field receiver, you can see [3] and [6] in bibliography.
The following scheme shows the circuit we have realized.
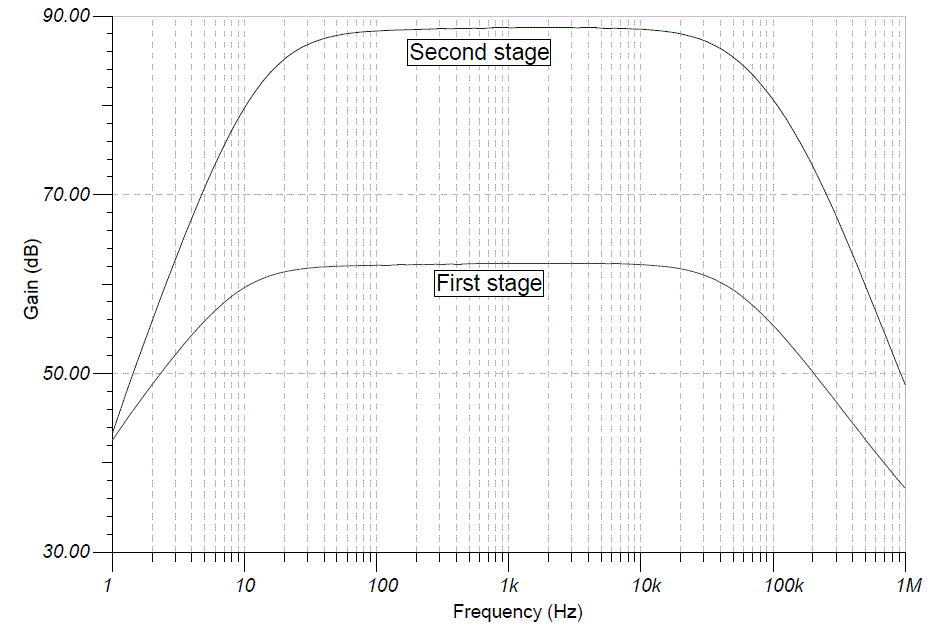
The following diagram shows the frequency response of the circuit:
Finally it can be noted that we did not use iron for fixing parts, but only copper for screws, and anchors.
On the prototype we performed many bench tests and the following tables show the results we obtained:


Subsequently we tested the windings with a RCL bridge and the results we obtained are shown below:


Finally we performed a test to identify the resonance frequency of the windings for the determination of the parasitic capacitance.
Using the inductance and resistance values showed in previous tables, we found the following results for the three axes of the winding:
X axis resonance frequency: 39,0 kHz parasitic capacitance: 184,5 pF
Y axis resonance frequency: 40,4 kHz parasitic capacitance: 176,5 pF
Z axis resonance frequency: 39,7 kHz parasitic capacitance: 170 pF
We then measured all the parameters of the probe and we can use them for subsequent circuit simulations.
The parameters that we inserted in the measurement receiver circuit model are the following:
Resistance: 190 Ω
Inductance: 89 mH
Parasitic capacitance: 185 pF
Cutoff low frequency (fc): 340 Hz.
3 – MEASUREMENT RECEIVER
Our interest is in magnetic field and so also the receiver will have to be sensitive to this field.
To reach our goal, we designed a two stage receiver. The first stage acquires the signal coming from the probe and operates on it a filtering operation and a first amplification. The second stage operates a final amplification with variable level by means of a switch.
The output of this stage is connected to the line input of the PC audio card.
The configuration of the operational amplifier offers a virtual short circuit to the signal coming from the probe so that the energy contained in the signal is transferred to the first stage of the receiver with virtually no loss.
In the reaction chain of the first stage we can see two RC cells that determine the pass-band.
The frequencies of the RC cells are 9,2 Hz and 49,9 kHz.
Remeber that the used probe (a small loop sensitive to the magnetic field) has two operating modes: resistive and reactive.
The transition from one mode to the other occurs in correspondence of the cutoff frequency (fc), defined as the frequency at which the resistance is equal to the inductive reactance.
Below fc the current in the loop increases with the frequency; above fc the current remains constant when the frequency increases.
The cell at 9,2 Hz introduces, in the reaction chain, a pole that makes the frequency response flat, compensating for the slope introduced by the probe below the cutoff frequency (resistive mode).
At fc, and above this frequency (where the probe works in reactive mode), the reactance of the capacitor (C13 in the scheme) is much smaller than the resistance (R13 in the scheme) and so only the resistive part of the second RC cell works introducing a flat amplification.
The cell at 49,9 kHz is a low-pass net which avoids the amplification of RF undesired signals and reduces the reaction impedance at high frequency so to prevent self-oscillations of the operational.
For more information about the magnetic field receiver, you can see [3] and [6] in bibliography.
The following scheme shows the circuit we have realized.

Fig. 3-1 Scheme of the
measurement receiver
The following diagram shows the frequency response of the circuit:

Fig. 3-2 Frequency
response
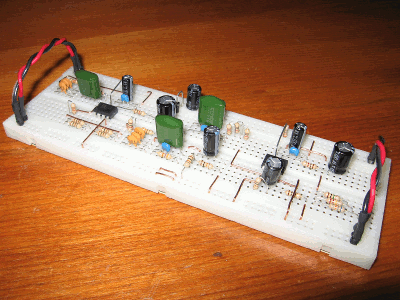 Fig. 3-3 Prototype mounted on breadboard |
With this scheme we realized a prototype mounted on a breadboard and enclosed, with his 12 V battery, in an aluminum box to obtain a good shielding. The probe is connected to the receiver with a pair of short (about 15 cm) RG58 cables fitted with BNC connectors and the cable shield is connected to the box. The output of the receiver is connected with a shielded cable to the line input of the audio card of the PC. The figures show the prototype and the probe connection. |
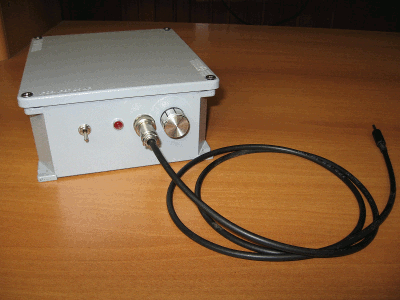 Fig. 3-4 External view of the box |
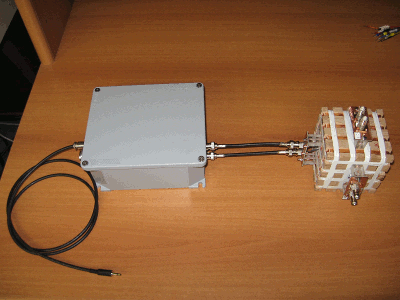 Fig. 3-5 Connection with the probe |
4 – FIELD TEST AND
CHARACTERIZATION OF THE SYSTEM
Now we have to test the measurement system, composed of the probe, the receiver and the PC for acquisition and treatment of the signal.
Since the sound card of the PC is an integral part of the measurement system, we performed, as a first step, a characterization to determine its frequency response.
We connected to one of the card input channels a signal from a generator with amplitude 10 mV at various frequency from 10 Hz to 20 kHz and we set, for the card, a sample rate of 44,1 kHz – stereo, with the other channel closed on a 50 ohm termination.
In this test, we obtained the following results:

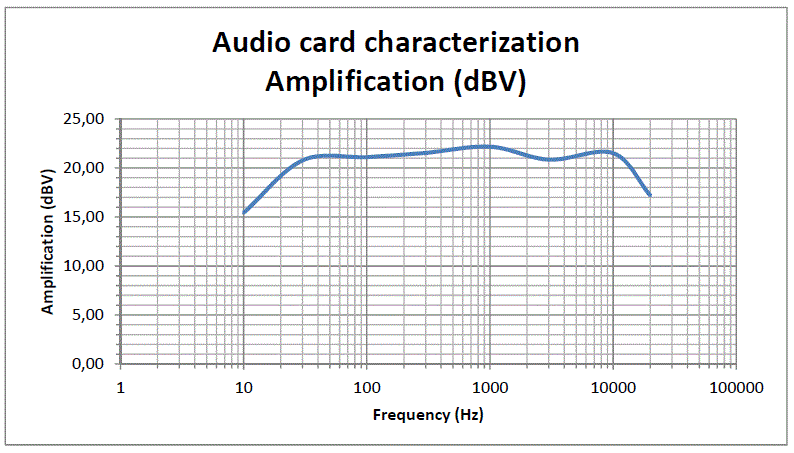
Fig. 4-1 Frequency response of the audio card
Now we must test the receiver introducing the probe in a known induction field.
We used the following configuration:
• transmitting loop: square loop of 40 turns – 0,5 m side;
• receiving loop: one of the three windings of the triaxial probe;
• variable frequency for the generated field from 10 Hz to 20 kHz;
• form of the current used: sinusoidal;
• generated induction field: about 470 pT (see tables below);
• distance from transmitting loop: 3,5 m;
• plane of the transmitting loop parallel to the plane of the receiving loop;
• maximum amplification selected on the receiver.
During the test we recorded (with SR of 44,1 kHz) the signals acquired by the audio card (connected to the receiver) and subsequently we analyzed them with FFT techniques (65 kp and Hamming window).
The first step of the analysis was to obtain the value of measured induction against the effective value generated by the transmitting loop.
Considering the numbers, we can evaluate the voltage and the short circuit current induced in the receiving loop:
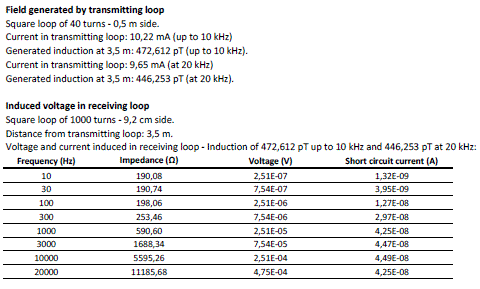
Next, by examining the recorded spectrogram, we can read the measured values at various frequencies. Then, using a circuital simulation software, we can determine the receiver amplification and, considering also the audio card, the total amplification of the system, as shown below:

Using the amplification values shown in the previous table, we can determine the signal levels at the audio card and receiver input.

Here “RX” is used with the meaning of “receiver”.
The induced voltage on the receiving loop is equal to the receiver input signal.
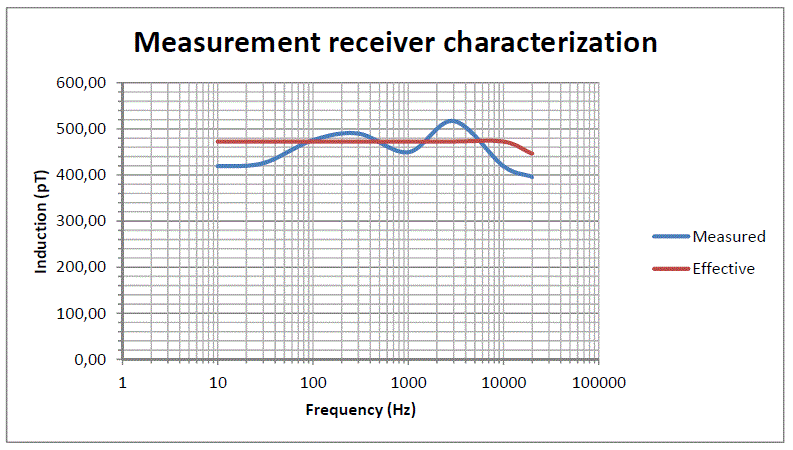
The diagram shown below indicates the effective induction value and the measured value.
The input level at the receiver is equal to the voltage induced in the receiving loop by the induction field. From this voltage we can obtain the relative induction value and this is the measured induction.

We must now examine the issues related to noise, sensitivity, saturation, and to the dynamics of the system.
Also these considerations can be deduced from the spectrograms related to the characterization of the audio card and to the measurement with the transmitting loop.
First we normalize at 1 kHz the data related to the characterization of the sound card.
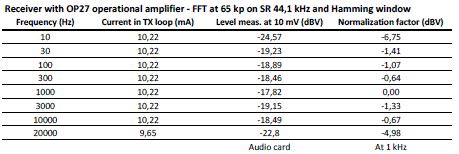
then we normalize to 1 kHz also the values measured by the instrument during the test with the transmitting loop and, from the recorded spectrograms, we can derive the noise floor.

Now we normalize at 1 kHz the noise floor values and we can evaluate the S/N ratio.

Finally we can determine the sensitivity of the system as shown in the table below.
Some diagrams graphically summarize the numerical evaluations previously made.

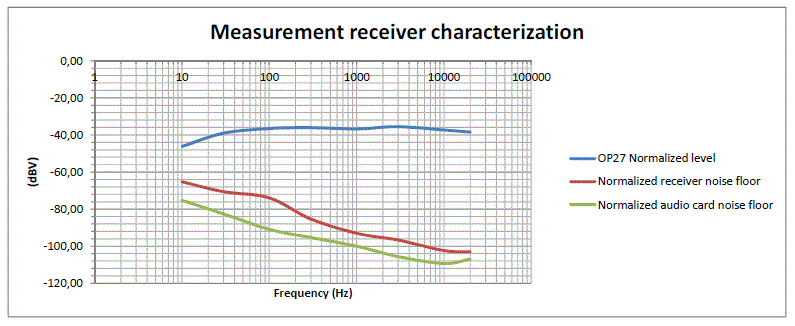
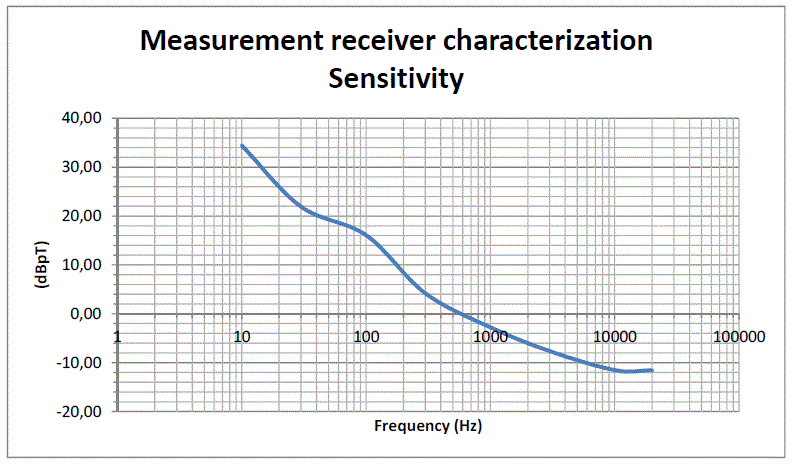
Fig. 4-4 Sensitivity
The last consideration concerns the determination of the maximum induction level (at 50 Hz) that causes the saturation of the receiver.
Using a circuit simulator, we can derive the voltage gain of the first stage at 50 Hz: this value is 33 dB equal to 44.6 times.
The OP27 operational amplifier is supplied with +/- 6 V DC.
As a precaution we can take an excursion of +/- 3.5 V RMS. Dividing this value by the gain at 50 Hz, we obtain the corresponding voltage value at the input of the first stage, ie 78.5 mV.
This voltage is generated by the probe when the induction value is 25 µT.
Obviously, when the induction is so high we will adopt a unity gain for the second stage.
Finally, because the sensitivity at 50 Hz is approximately 10 pT, at this frequency the dynamic of the measurement system (with a unity gain for the second stage) is about equal to 128 dB.
5 – THANKS
Many thanks to:
Renato Romero for his technical support both in design and in final tests; without his great experience and his help this project would not have been realized;
Marco Bruno (Spin Electronics – Rivalta – Turin – Italy) who provided an excellent RCL bridge (HP 4274A) used for bench measurement on probe;
Prof. Silvia Carnisio for grammar review.
6 – BIBLIOGRAPHY
[1] http://quickfield.com/, the website of QuickField software, Tera Analysis Ltd, Knasterhovvej 21, DK-5700
Svendborg, Denmark;
[2] “QuickField 5.9 – User’s Guide”, Tera Analysis Ltd.;
[3] “A minimal ELF Loop Receiver”, Renato Romero IK1QFK, on http://www.vlf.it/
[4] “Thinking about ideal loops”, Marco Bruno Ik1ODO, on http://www.vlf.it/
[5] “AN710 - Antenna circuit design for RFID applications”, Microchip Technology, 2003;
[6] “Radio Natura”, Renato Romero, Sandit Libri, 2006;
[7] “Finite elements for electrical engineer”, P.P. Silvester, R.L. Ferrari, Cambridge University Press, 1983;
[8] “Campo magnetico prodotto da cabine di trasformazione”, D.M. Carrara, M. Zavatti, M.T. Cazzaniga,
A. Canova, G. Gruosso;
[9] CEI 211-4 "Guida ai metodi di calcolo dei campi elettrici e magnetici generati da linee e da stazioni
elettriche";
[10] CEI 211-6 "Guida per la misura e la valutazione di campi elettrici e magnetici nell'intervallo di frequenza
0 Hz - 10 kHz, con riferimento all'esposizione umana".
Now we have to test the measurement system, composed of the probe, the receiver and the PC for acquisition and treatment of the signal.
Since the sound card of the PC is an integral part of the measurement system, we performed, as a first step, a characterization to determine its frequency response.
We connected to one of the card input channels a signal from a generator with amplitude 10 mV at various frequency from 10 Hz to 20 kHz and we set, for the card, a sample rate of 44,1 kHz – stereo, with the other channel closed on a 50 ohm termination.
In this test, we obtained the following results:


Fig. 4-1 Frequency response of the audio card
Now we must test the receiver introducing the probe in a known induction field.
We used the following configuration:
• transmitting loop: square loop of 40 turns – 0,5 m side;
• receiving loop: one of the three windings of the triaxial probe;
• variable frequency for the generated field from 10 Hz to 20 kHz;
• form of the current used: sinusoidal;
• generated induction field: about 470 pT (see tables below);
• distance from transmitting loop: 3,5 m;
• plane of the transmitting loop parallel to the plane of the receiving loop;
• maximum amplification selected on the receiver.
During the test we recorded (with SR of 44,1 kHz) the signals acquired by the audio card (connected to the receiver) and subsequently we analyzed them with FFT techniques (65 kp and Hamming window).
The first step of the analysis was to obtain the value of measured induction against the effective value generated by the transmitting loop.
Considering the numbers, we can evaluate the voltage and the short circuit current induced in the receiving loop:

Next, by examining the recorded spectrogram, we can read the measured values at various frequencies. Then, using a circuital simulation software, we can determine the receiver amplification and, considering also the audio card, the total amplification of the system, as shown below:

Using the amplification values shown in the previous table, we can determine the signal levels at the audio card and receiver input.

Here “RX” is used with the meaning of “receiver”.
The induced voltage on the receiving loop is equal to the receiver input signal.
The diagram shown below indicates the effective induction value and the measured value.
The input level at the receiver is equal to the voltage induced in the receiving loop by the induction field. From this voltage we can obtain the relative induction value and this is the measured induction.


Fig. 4-2 Measured and
effective induction
We must now examine the issues related to noise, sensitivity, saturation, and to the dynamics of the system.
Also these considerations can be deduced from the spectrograms related to the characterization of the audio card and to the measurement with the transmitting loop.
First we normalize at 1 kHz the data related to the characterization of the sound card.

then we normalize to 1 kHz also the values measured by the instrument during the test with the transmitting loop and, from the recorded spectrograms, we can derive the noise floor.

Now we normalize at 1 kHz the noise floor values and we can evaluate the S/N ratio.

Finally we can determine the sensitivity of the system as shown in the table below.
Some diagrams graphically summarize the numerical evaluations previously made.


Fig. 4-3 Levels
representation

Fig. 4-4 Sensitivity
The last consideration concerns the determination of the maximum induction level (at 50 Hz) that causes the saturation of the receiver.
Using a circuit simulator, we can derive the voltage gain of the first stage at 50 Hz: this value is 33 dB equal to 44.6 times.
The OP27 operational amplifier is supplied with +/- 6 V DC.
As a precaution we can take an excursion of +/- 3.5 V RMS. Dividing this value by the gain at 50 Hz, we obtain the corresponding voltage value at the input of the first stage, ie 78.5 mV.
This voltage is generated by the probe when the induction value is 25 µT.
Obviously, when the induction is so high we will adopt a unity gain for the second stage.
Finally, because the sensitivity at 50 Hz is approximately 10 pT, at this frequency the dynamic of the measurement system (with a unity gain for the second stage) is about equal to 128 dB.
5 – THANKS
Many thanks to:
Renato Romero for his technical support both in design and in final tests; without his great experience and his help this project would not have been realized;
Marco Bruno (Spin Electronics – Rivalta – Turin – Italy) who provided an excellent RCL bridge (HP 4274A) used for bench measurement on probe;
Prof. Silvia Carnisio for grammar review.
6 – BIBLIOGRAPHY
[1] http://quickfield.com/, the website of QuickField software, Tera Analysis Ltd, Knasterhovvej 21, DK-5700
Svendborg, Denmark;
[2] “QuickField 5.9 – User’s Guide”, Tera Analysis Ltd.;
[3] “A minimal ELF Loop Receiver”, Renato Romero IK1QFK, on http://www.vlf.it/
[4] “Thinking about ideal loops”, Marco Bruno Ik1ODO, on http://www.vlf.it/
[5] “AN710 - Antenna circuit design for RFID applications”, Microchip Technology, 2003;
[6] “Radio Natura”, Renato Romero, Sandit Libri, 2006;
[7] “Finite elements for electrical engineer”, P.P. Silvester, R.L. Ferrari, Cambridge University Press, 1983;
[8] “Campo magnetico prodotto da cabine di trasformazione”, D.M. Carrara, M. Zavatti, M.T. Cazzaniga,
A. Canova, G. Gruosso;
[9] CEI 211-4 "Guida ai metodi di calcolo dei campi elettrici e magnetici generati da linee e da stazioni
elettriche";
[10] CEI 211-6 "Guida per la misura e la valutazione di campi elettrici e magnetici nell'intervallo di frequenza
0 Hz - 10 kHz, con riferimento all'esposizione umana".
Return to www.vlf.it home page