This article
describes
the actual state of knowledge of ELF receiving experiments
whose basic
steps were published in an earlier article on this website.
Summary
Everybody who is talking about electro smog usually thinks about frequencies in a range from 50 or 60 Hz (mains frequency) up to some Gigaghertz, the frequencies, where cellular phones are working with. Below 50 Hz, there are no electromagnetic waves at all, so the common opinion. That this is not true can be proofed by the fact, that the electric currents coming from railway lines at least in Germany work at a frequency of 16.66 Hz and can be detected with a relatively high level even many miles away from railway lines. But not enough with that: The authors of this website were able to detect a great number of electromagnetic signals of frequencies even below 16 Hz. The authors found out, that the signals in question were created by extremely low currents flowing through the ground under our feet. Their frequencies are ranging between 0.5 and 25 Hz and their structure makes them appear to be of artificial origine. Inspite of an extremely intensive research, the authors did not find any single scientific publication of their existence, their origine and of their purpose.
Facing these facts, the authors (see end of the article) started a scientifical project, hoping to find out the answers of the questions above and also hoping to find out if these signals inspite of their small levels could do any harm to human beings, last but not least because of their frequencies, which partly cover the range of human brainwaves.
In combination with their work, they intended to develop a highly sophisticated receiving and data logging method for a simple use in combination with even old second hand PCs with an extremely high signal to noise ratio, which is absolutely necessary to detect these extremely low leveled signals.
At the present date, all the hard- and software which is needed for such a project is finally developped after more than one year of hard work in the PC- and electronics lab.
Next step will be synchroneous measuring on wide areas to get a geographical map of the location of the signals mentioned above. The authors found out, that there are
Features of the Circuit developped by the authors
To get the signals we talk about in this article, a special hard- and software is needed. The authors developed their own equipment which has the following features:
In regard to protect the authors rights, we
hope readers may understand that we do not publish any details
of hard
and software here on this web page. If you like to contact us
seriously
for joining our work or offer us a platform to continue our work
within
the frame of e.g. a scientific doctors degree, your email will
be welcome.
Measurements and experiences
From summer 2002 until summer 2004, hundreds of measurements were made at least 8 hours per day at different hours with a simple pre-model of the receiver. From these measurements, the authors got much experience about the time and frequency structures of the signals and learned about the different signal types that occured: some were regulary, others more sporadicly. Based on these knowleges, the authors were able to construct the new, better type of receiver described above. With this new receiver which was built up twice, the authors could start with parallel measurements on two constant but different locations since a few weeks. With their parallel measurements they discoverd, that the signals are not global (as estimated before), but local and can differ completely at distances of at least 30 kilometers. More measurements at different locations will be necessary to map the distribution of the signals and to find out their source. The following commented screenshots will show some examples of the different types of signals in detail:
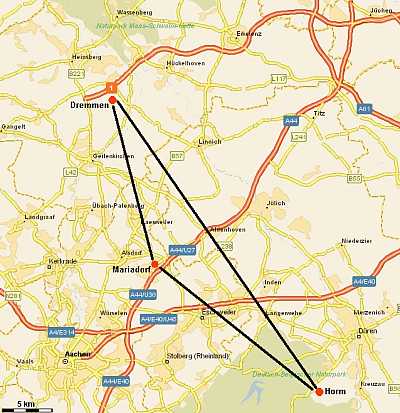
The signals were recorded in the Eifel mountain region, 40 km west of Cologne (Köln) at Hürtgenwald-Horm, the private location of one of the authors. Previous measurements also were made with the simple pre-version of the receiver near Stuttgart and near Heinsberg in Germany in the year 2001. The last picture shows a comparison with a recording made near Alsdorf in Germany during parallel measurements in april 2005.
Map with the three measurement stations. The next city is Aachen which is close to the border to belgium and netherlands.
Discussion of recorded signals
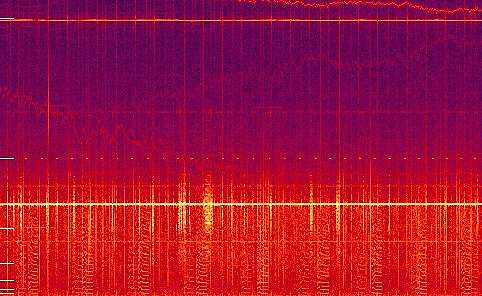
Figure 1
Figure 1 shows a recording made during the night from 10th to 11th of april 2005. The recording shows a time schedule of 4 hours from 10 pm until 2 am. The horizontal line on the upper edge of the picture is created by the 50 Hz mains signal, which is extremely attenuated. The linear frequency range goes up to 25 Hz. The upper limit of the linear range is represented by the dotted horizontal line in the middle of the picture. These dots (becoming interrupted lines when zoomed) are created by an unknown signal source that can be received permanently night and day since approximately one year.
The most spectecular line in this picture is created by the 16.66 Hz signal of the railway power lines, serving as a reliable reference source (the railway line is about 6 kilometers away from the receiving location).
The "cow" signal
Between the 16 Hz line and zero you can find repeated patterns of parallel lines which are shown in a magnified version in figure 2. These signals last about approximately 5 minutes and consist of a base frequency line of 0.8 Hz and more than 20 harmonics. As the distances between the harmonics are equal to the base frequency, the time signal characteristic corresponds to a ramp function.
Typical for this kind of signal is also the fact, that the frequency at the beginning of the signal is moving to a higher level, then coming down again and staying constantly at the same level until the end of the signal, which is characterized by a clear and sudden cut.
This kind of signal was recorded day and night permanently since the beginning of the measurements at the location Horm in 2002. The time distances between consecutive signals are not regular and change between approximately 3 minutes and a few hours – but never more.
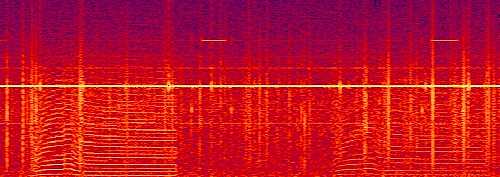
Figure 2: Magnified cut of figure 1. Total time approximately 15 minutes
We don’t have to forget to mention, that there are two different signals of that type. The second pattern at figure 2 appears similar to the pattern on the left, but it seems to come from a different source: it is lower in its level and also in its frequency. Both signals appear independently from each other and sometimes even appear at the same time and interfer. Generally we can say, that signal two appears not so often as signal one.
The structures of both signals are always the same. The only difference can be regarded in the fact, that the horizontal lines at the end of the pattern sometimes last a little longer than shown above (more than double or even longer) – but this happens very rarely.
This kind of signal also can be recorded at a location about 30 kilometers from Horm (Alsdorf-Mariadorf), but it is probably not the same source, because the time pattern does not correspond: The signal there appears at totally different times. Besides, it is not as strong as measured at Horm.
If the signal is made audible, the signals above sounds like the voices of cows. That’s the reason why we called this signal the "cow signal".
By the way above the 16 Hz-line, in figure 2 you can see much more clearer two parts of the "dotted" line of figure 1 at 25 Hz.
Possible explanations for the origine of the "cow signal"
In scientific publications in the internet we found seismic signals of so called "volcanic tremors". These signals are of the same time and frequency structures like the cow signal and were recorded in the neighbourhood of vulcanoes at e.g. the Philipines. But there’s one problem: volcanic tremors are seismic events. These signals are recorded by mechanical detectors and not by recording systems for electromagnetic waves. Could it be that mechanical vibrations of rocks create corresponding electrical currents by the known piezo effect? If it would be like this: Why do we receive volcanic tremors in the middle west of Germany? Is it because at the Eifel region (south of Horm) there still are some inactive volcanoes which had their last eruption "only" 10000 years ago? Could it be possible, that some thousand meters under our feet fluid magma material is still circulating and creating these strange signals?
If this theory seems too unrealistic, we have another solution: Near Horm and also near Alsdorf there are big areas where private waste (litter) is stored. To avoid environmental pollution problems, big water pumps are permanently controlling the flew of ground water there. Could it be that those big pumps with their high energy consumption are the source of these "cow" signals? But how can it be that pumps create signals of 0.8 Hz?
If you do not agree with this theory too and you think that somewhere a manmade transmitter is permanently sending out this signal, you have to explain why this should be done and by whom. In modern times of internet, radio and satellite communications, it makes no sense to send out signals through the earth, with the help of extremly low frequencies which allows only a very poor information transfer rate.
The "Goose" Signal
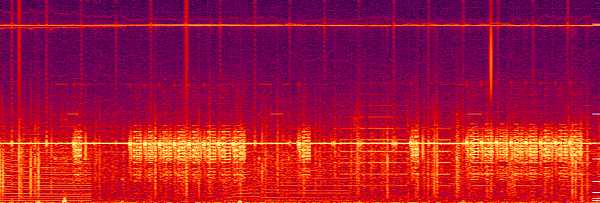
Figure 3: The "goose"
The signals in figure 3 we called "goose" because the sound of the playback reminds of the sound made by these animals.
Typical for this kind of signal is the fact,
that
there are elementary units which sometimes appear single and
sometimes
in groups up to eight "members" (but never more). These signals
also can
be received constantly day and night, but in irregulary time
distances
and group configurations. Sometimes they can be recorded at our
two measurement
stations (30 km distance) with the same strong intensity, so
that we could
use them in some cases as a time reference base. It looks as if
these signals
have something to do with the 16 Hz railway sinewaves because of
the typical
nodes on the 16 Hz line, but this may be a coincidence: At the
second station,
the 16 Hz railway signal is not as strong as shown in figure 3,
but nevertheless
the "goose" can be found with the same intensity.
Our measurements
discovered
that the goose signal’s time structure is repeated in
sequences of 24 hours.
Besides, each goose signal owns the same elementary
components, consisting
of a kind of header, followed by marks which consist of four
16 Hz pulses
building up a regular pattern. The first pattern is formed by
eleven marks
among which always one mark (e.g. number four) is missing. The
second pattern
is more complex and not yet identified.
Figure 4: Magnified
structure
of a typical goose signal:
Mark number nine of the
pulse
structure in the middle is missing in this case.
The "whistler" signal
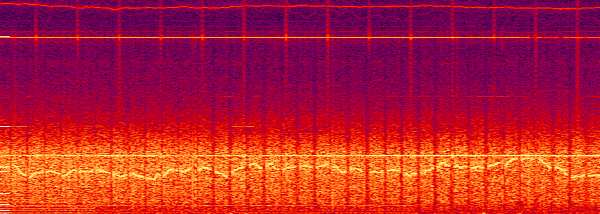
Figure 5: The "whistler"
The whistler is one of the most strange signal we receive. It can be found only at daytime and starts each day between 9 and approximately 12 o’clock, lasting at least about four hours. When made audible, it sounds like someone who is whistling a melody in quick notes. Typical for this kind of signal is a certain background noise, appearing at the same time the whistle tone can be heard. The length of the pattern created by the tones and by the interruptions is always the same. Sometimes, we receive groups of 11 to 17 tones, interrupted by a short break – and sometimes, no interruptions can be found, as shown at figure 4.
Also typical is the fact, that the sinoid components don’t jump like a familiar melody in their frequency but follow a line moving up and down continuously and sporadicly. The whistling tones are characterized by repeated frequency-time patterns like v, /, \, ^, ~, which look like letters of a secret code.
Sometimes, the signals look like to be part of a kind of communication: Between longer breaks within these signals we found the same signal structure with a lower level, as if an opposite station would give an answer.
The "locomotive" signal
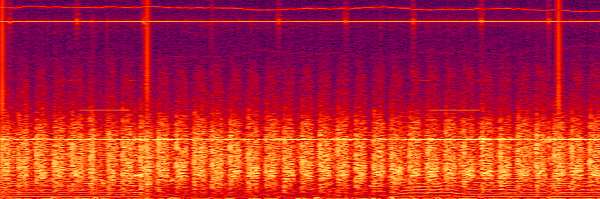
Figure 6: the "locomotive"
This signal does not appear as constantly as the "Whistler" but looks similar because it can be interpreted as a "Whistler" with only noise but no sinusiodal components. In cotradiction to the whistler, it can occur at daytime as well as at nighttime. The noise structure patterns can differ in length per session but principally remind of the sound of an old steam locomotive. Experiments whicht interpreted the signals as faksimile messages to transfer images were carried out without any success until now. The "locomotive sound" is known to the authors since the beginning of their measurements.
The "heartbeat monitor" signal
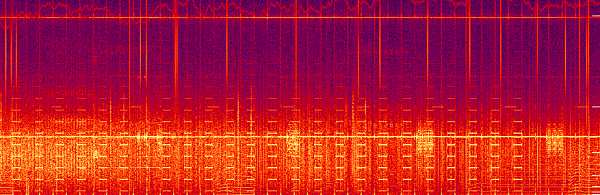
Figure 7: The "heartbeat monitor"
In comparison to the "Locomotive", the "Heartbeat monitor" was discovered the first time at the end of 2003 and appeared at the beginning each morning between 6 and 7 am. The sound reminds of the clear and loud emergency signal of a heartbeat monitor. Audibly trained people may notice the typical sound of a square wave signal of 50 % duty cycle, which can be proofed by the character of the spectral lines: if the base frequency (less than one Hz) would be one, the first harmonic would be three, next would be five and so on.
The sound of the "beeps" is quite regulary, but sometimes it sounds as if they would come a little "out of rhythm", specially at their beginning. Sometimes, the beeps are repeated only a few times, and sometimes the occur more than 30 times in constant time distances. Beside their number and their time distances, the beeps don’t seem to carry any additional information
A few months after they were received for the first time, they also appeared at different day and night times and not as regulary as before. They also can be received at the parallel station at Mariadorf, but at different day and night times. This may proof, that the signals are emitted by different local sources.
Additional signals
Beside these signals documented above, sometimes we receive additional different signals. One of them reminds at the sound of an old fashioned needle printer, other sound like RRTY-Signals which can be received on shortwave. In addition, sometimes very short but obviously artificial signals can be received, such as sinewaves of diferent frequencies looking like steps in the spectrum versus time analysis and which always have the same structure over long receiving periods.
Parallel measurements
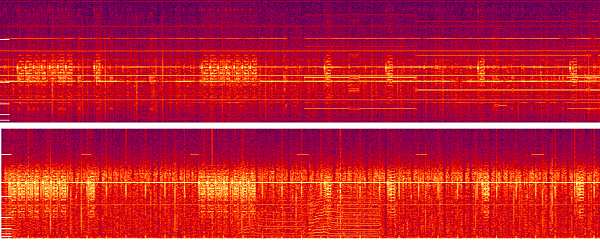
Figure 8: Parallel measurements
The last picture shows two independent measurements made at the night between the 11 and 12 april 2005. The signal above was recorded at mariadorf, and the signal below was recorded at the same time at Horm, located approximately 30 km away from mariadorf. The two spectrograms represent in a significant way that the so called "goose" signal is recorded with the same intensity at both locations. The shown recording time is approximately one hour. The "goose" signal therefore must have a single source and must have an intensity that enables it to be received in such big distances. Figure 9 shows a magnified section of figure 8. In the lower analysis at figure 9 you will recognize two "cow" signals (one of type a, the other on of type b), which only could be received at the location Horm, but not at Mariadorf.
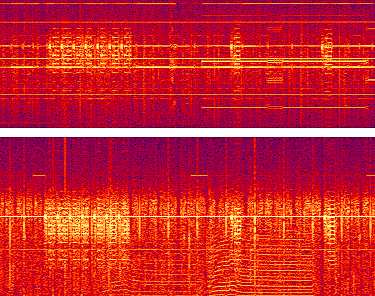
Figure 9: magnified section of figure 8
Possible sources of the signals
Latest measurements showed, that all the signals in question can be measured with their strongest intensity, if the coil antenna is located in the streets of a village near the place, where gas and water pipelines and the main cables of the electric power supply are positioned. About a hundred meters and more away from any location where these supply structures are present, the signals are extremely low or sometimes even not measurable. But what does this mean?
As we found more than 20 completely different signal types partly being active at the same time and at the same low frequencies under 16 Hz, it seems impossible that electronic pipeline pressure control systems controlled by our town governments could be the reason of that kind of emission.
Are the gas and water pipelines or the electrical main wiring abused by other institutions for communication purposes? If so, does is happen with or without the agreement or knowledge of those who are responsible for the water, gas or electricity supply system?
Or do the signals in question propagate via the surface of the ground and are only attracted and focussed by water or gas pipelines in the underground, working as a big antenna which collects the ground currents and focusses them?
Last not least, the most important question: Could those signals in the range of brainwaves do any harm to human beings?
To find out the
solution,
more investigation will be necessary.
Author web page: http://www.subroutine.jimdo.com