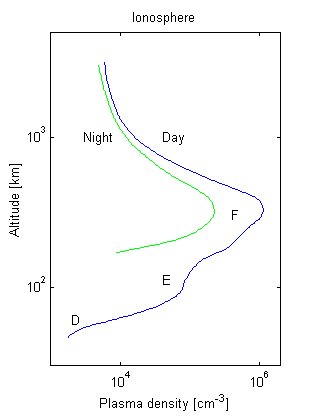
In the image above is shown the difference of the amount of free electrons and ions between night and day, at different altitudes.
In the left image is visible the stratification of the atmosphere.
By Claudio Parmigiani IW2FER
Can a lightning strike be
frozen ? The answer is "yes", we can record and post-process its electromagnetic
footprint and analyze it later.
This is what we do during
VLF recordings, saving thousands of single events, everyone different from
each other.
Depending on the distance of the event and many other factors the lightning can mainly be recorded as:
"Radio Atmospherics" or "Spherics"
or simply "Statics" are the electromagnetic signals launched by single
lightning discharges.
The bandwidth of every signal
is very wide, from few Hz to several tens of MHz.
Lightning discharges radiate
the bigger part of their electromagnetic energy in the VLF (3 - 30 kHz)
and ELF (3 - 3000 Hz) frequency range.
Due to the fact that lightning
happens mainly between stormy clouds and the ground, the radiated energy
does not spread out as it should do in free, empty space.
The signal is reflected between
the ground and a conductive region of the atmosphere called Ionosphere.
In the Ionosphere, for the
combined actions of various processes (i.e. solar wind) there are many
free electrons and ions. These particles (and their concentration) are
responsible for the behaviour of this atmosphere layer.
Ionosphere is divided in four
sub-regions commonly called "D", "E", "F1" and "F2" layers, the height
vary from 60-90 km (for the "D" layer) to 250-300 km.
The electrons density has
great variations during the cycle night / day, this causes different behaviours.
|
The powerful ultra-violet solar radiation hit neutral
oxygen atoms. Photons at these frequencies can dislodge an electron and
create an ionized atom plus a free electron.
In the image above is shown the difference of the amount of free electrons and ions between night and day, at different altitudes. In the left image is visible the stratification of the atmosphere. |
The measurement of free electrons
in the sublayer "D" is particularly difficult because its height is too
low for satellites and too high for balloon probes.
It is possible to measure
it indirectly, studying the propagation of known VLF emissions .
A sferic is defined as the return stroke of a cloud-to-ground lightning discharge. It occurs after a conductive channel has connected electrically the ground and the charged cloud. The current itself is responsible for the transfer of energy and for the emissions in VLF / ELF band.
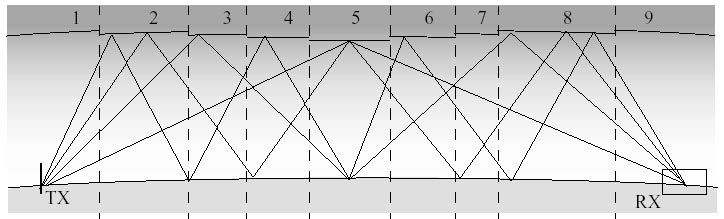
Picture above shows a modelization of the mutiple
path of a VLF transmission. Different ionization levels of the ionosphere
causes different angles of reflection.
It has been taken from the PhD thesis of Dr. Michael
P. Johnson at url: http://www-star.stanford.edu/~vlf/publications/theses/mikejthesis.pdf
Same thing happens also with sferics.
Thanks to Dr. Troy G. Wood (PhD at Stanford University), he made clearance about "Lightning Strike" and "Lightning Flash" and other common phenomena related to sferics.
There is often a lot of confusion about the term "lightning strike". More often the term "lightning flash" is used incorrectly.
Lightning flash refers to the entire lightning event which is composed of many parts.
What we record as a sferic is actually created by a single lightning return stroke, duration of the event is only a few milliseconds.
Each lightning flash may consist of one, two or even 20 or more return strokes each of which will create a sferic.
Return strokes are typically separated by ~60 milliseconds
so it is usually easy to resolve individual sferics. However, there
is the possibility to record two sferics coming from two different locations
arriving at the receiver simultaneously.
This will produce an interference.
Earth / Ionosphere cavity system has some well defined cutoff frequencies, due to its geometry.
Tweeks, for example shows a marked cutoff under
a certain frequency.
This is because their high frequencies reach the
receiver before the low ones. This is called delay dispersion, and it is
a typical phenomena when dealing with waveguides.
So, every waveguide has a low-frequency cutoff
caused by its physical and geometrical size. If the frequency of a signal
is close to the cutoff frequency of the waveguide, it will travel slowly
then other frequencies. The first cutoff is at about 1.7 kHz (hypotizing
an ionized "D" Sublayer at ~70 km above the ground) and occur at about
every 1.7 kHz above that.
1.7 kHz and 3.4 kHz are typically observed analyzing
tweeks events.
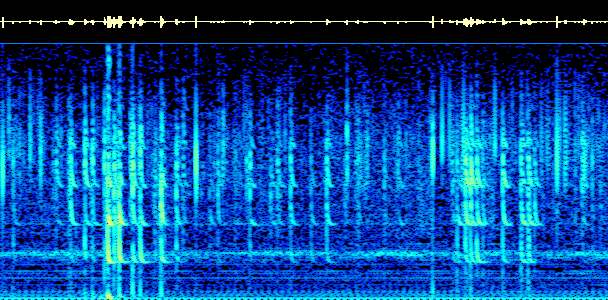
Now let's have a look at the following picture:
Pic shows some sferics and tweeks in the band 0-11
kHz with a FFT of 512 pts (about 2 seconds, recorded in Cumiana Italy by
IK1QFK in date 971008-0102). Tweeks present are of 1°, 2°, 3°
and 4° order, respectively at frequencies 1650, 3300, 4950 and 6600
Hz.
Beyond tweeks, vertical sferics shows an unusual
horizontal segmentation.
Gap frequencies are always different and are very
well spaced and repetitive.
 |
It seems that some frequencies are "absorbed" by
the earth/cavity system but missing frequencies are not always constant,
so there could be a correlation between missing frequency slices and energy/distance
of the main event.
|
Dr. Wood wrote:
"Above the second cutoff the phase velocities of
the higher order modes are significantly different from the low order modes
causing rapid interference variations.
This is very sensitive to distance which may explain
why each event has its own footprint.
Above about 10 kHz this effect is less rapid due
to the introduction of even more modes resulting in a more complex interference
pattern and thus a slower variation in signal amplitude.
Since the pattern in some of your sferics is visible
up to ~20 kHz I would say that these sferics are probably generated by
a relatively close lightning strike, say ~200-400 km"
"Also, the spectrum of a lightning stroke is not composed by "pure" white noise, but looks more like a decaying exponential (in VLF) but this won't affect the interference pattern a a particular frequency only its amplitude".
As said, above the cutoff frequencies higher order modes can add constructively or destructively to the signal (this is the reason for the segmentation). It may be possible to to get some range information from this but it has not been done at VLF frequencies.
With this informations I have added another little piece to my knowledge about VLF and its complex phenomena, hope this document will help someone else.
Credits / Thanks to: