|
The target of this article is not a disquisition about the existence or not of seismic precursors, but a verification of the presence (or absence) of radio seismic signals together of an event and in a given frequency range. The research has, as its target, the verification or the exclusion some frequency bands from the study of possible links between seismic phenomena and emissions of radio frequency directly linked to them. |
INTRODUCTION
Yes, you're right! We are not talking about a system
which forecast the earthquake happenings, but simply a system able to verify
that to a seismic event corresponds contemporarily a radio event. It is
not possible to begin speeches about forecasting if not tested a radio
listening practical method of seismic crack point.
We have first to find on which frequency band these
events occur; we have to verify that their intensity be received from a
certain distance. It is necessary to test which reception system is more
proper to get these signals. In order to do this we take as postulate that
a seismic radio signal can be so called only if is associate to a mechanic
movement ground signal and vice versa. In other words: if the seismograph
reveals something the receiver must receive and vice versa. In this case
only we can talk of a radio seismic signal.
RESEARCH PARAMETERS
In this monitoring, as said at the beginning, it'll
be takes in exam seismic episodes only which have produced reactions on
the close seismograph observatories. Plus it'll be excluded from the research
the events occurring at a distance more than 800 km, even if they are revealed
from the seismograph. The observation range is the range portion of frequency
from 500mHz (0,5Hz) to 200Hz. The sample rate utilized is in all cases
5525 sample/sec.
The FFT input size of 16384 points gives a 0,34Hz
resolution, this parameter, one side makes visualized in a correct way
the frequency portion in exam, in the other side it limits the revelation
of the more than 3 sec during signals. In order to make this choice, of
course doubtfully on many aspects, I followed the Prof. Mognaschi and Ugo
Zezza (university of Pavia) data researches, consisting on a study of radio
spectrum originating from a broken rock cube under a mechanical presser.
These researches, presented in Florence (Italy) on September 2000 on the
international congress "DETECTION OF ELECTROMAGNETIC EMISSIONS FROM FRACTURE
OF ROCKS AND BUILDING STONES UNDER STRESS" say that these signal are durable
in the time and that, this permanence should overtake the given time limit.
Inferior during signals, as for instance 0,1 sec,
are not totally eliminated, but their presence is simply reduced in function
of the distance from the corner frequency caused by FFT function set to
3 Hz (1/resolution). A 1,5 sec permanence signal will be mediated with
the remaining non signal 1,5 sec, and will be so lightened of 50%. The
non drastic effect of this cut is visible on static of 1 sec casting (1/30
of FFT buffer filling time) that are visualized because of their strong
intensity.
SEISMIC MONITORING NET
 |
I'm "lucky", I live in seismic area. This offers
me the opportunity of researching a certain number of short phenomena,
without searching for years just to discover at the end that there are
not radio seismic signals. Thanks to this I can observe these phenomena
relatively close without associating events from the other part of the
globe, which, for many variables, always are discussible. The geographic
map beside shows the quantity and the place of the seismic events that
have happened when I have been living for 14 years now.
They are not so strong events under magnitude 4 but the quantity of them, underlined with black marks, is remarkable. |
|
|
The chart show a square area of 300 km x 300 km |
A good seismic area, since that offers many study
occasion for the researchers, can not be without a seismic net. In fact
they are several. The most popular is MED-NET, which covers all the mediterranean
sea with its observation points.
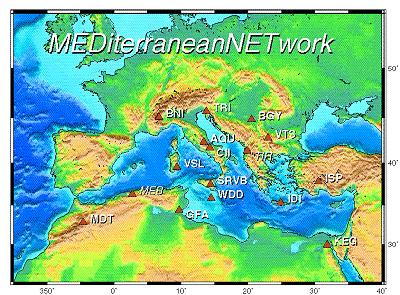 |
The shown map shows the observation points in the
mediterranean sea. For further information about this net being part of
the Italian Geophysical National Institute, you can visit the official
site http://mednet.ingrm.it.
This research is based, for a part of the signals, on seismic data given from this net. The MED-NET net puts on web for every single event the geographic map with the geographic points where the phenomenon has been found with the seismic observation points marked with the even geographic seismic direction finding (triangulation). In the research only episodes where the close BNI observatory finds the seismic mechanic wave have been considered. |
The med net is not the only one to do this service.
At a local level, in fact other nets exist which can make a study occasion
about even lighter seismic events which happen close to my qth. From these
net generally are diffused also data which are more difficult to find on
other national nets.
 |
This is the case of the IGG seismic net. The map
shown beside, shows the stations disposition. My qth, indicated by the
red arrow, is practically in the middle of the stations of this net. In
this case also, data are available on web at url:
http://www.dister.unige.it/geofisica/ITA/main.html In order to give an idea of the seismically of the zone, you can think of the week from 20/8/2001 to 26/8/2001, in the area shown on the map that 19 seismic event have been recorded. |
RECEPTION SYSTEMS
Once chosen the band frequency to monitor, you
have to make a choice for the best antenna to receive those signals. In
this gap of frequency there are different utilized antenna systems: all
very effective, even if with very different results from signal to signal.
From the past researches we know that 82 Hz signals
for submarine in immersion, are very well received by marconian antennas,
discretely with earth dipole correctly oriented but they are not receivable
with horizontal loops of big dimensions.
Vice versa some tone perhaps not trasported by
the electric net, with unknown origin and target, put in certain sequences
between 70 and 20 Hz are receivable with the horizontal loop, discretely
with earth dipole and not receivable with marconian antennas, even if of
big dimensions.
Last but not least, Schumann resonances, receivable
by big marconians, are not visible in the horizontal loops receptions,
while they give some tracks of their existence with earth dipole in certain
hours of the day.
A so large view cannot exclude any system, because
they are not known the eventual signal to receive.
For this research three different antenna systems
have been used:
a) T marconian electric antenna, 11m high with double top of 45m, connected on preamplifier circuit using OP07 as described on the IK1ODO article. See below the easy scheme.
B) An earth dipole, North-South oriented, and obtained
by two aluminium bars put in the ground for 40 cm and distant from themselves
30 metres. Connected to a similar circuit used for Marconi antenna: an
high impedance is required to avoid an electrolysis phenomenon on the metal
bars: very high impedance, very low current, so very weak electrolysis
damage.
c) A big 3 turn horizontal square loop, 30m side
for a 2700 square meters total area; connected to an easy OP027 preamplifier,
as described in the fake signals session in this same site.
SIGNALS RECORDING
A similar research cannot forecast a operator physical
presence 24 hours a day waiting an earthquake. The acquisition station
so, works automatically, by using as acquisition card a common sound blaster
and, in some observations the "Spectrogram" application (the classical
of Horne) and the 20/20 program, as already described in the unattended
operations session of this site. For the remaining observations the SpectrumLaboratory
DL4YHF application has been used, which has in a single software pack
the elaboration program and the spectrogram saving one.
Concerning the spectrogram setting different gaps
between 0,5 and 200 Hz have been chosen, with screen shots between 9 and
30 minutes for every kind of antenna. The spectrogram so obtained are many
numerous but this was necessary because of the short period of signals
lasting connected with an earthquake.
With this system they are acquired and saved near
10'000 spectrogram each month that give the continuos visualization of
radio phenomena about the band in exam. About every days, once obtained
550 Mb of spectrogram occupation disk, all the material is saved on cd-rom
and enters in a permanent archive.
SEARCH RESULTS
Obtained results has been
identical for all monitored seismic events. In the following list we can
see a little selection
of all monitored events (they are normally more then 50 every month). In
this selection has been used all the kind of choose antennae and the two
software, Spectrogram with 20/20 and SpectrumLab. The following data are
interesting: they don't pick up the complete representation of the many
observed episodes, but give a clear idea about how to plan a research of
this kind on this topic.
a - SEARCH RESULTS on BIG
HORIZONTAL LOOP
The two following episodes have been gotten with
a 3 turns big horizontal loop. SpectrumLab is the used program. This program
has the big vantage of being created on just for this kind of observations:
the saved screens collects all frequency and time data which can help a
signal identification.
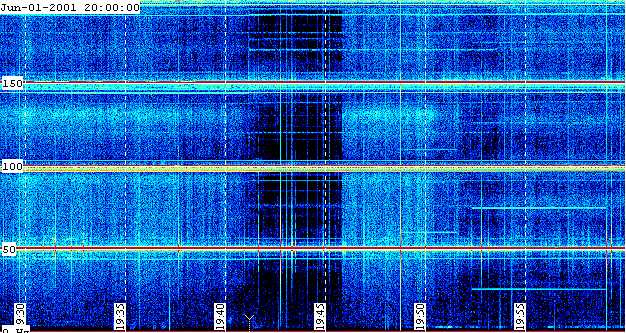
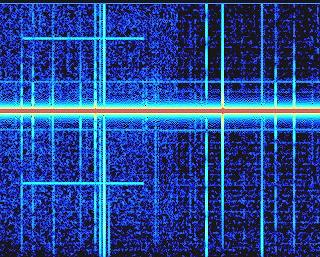
010301 1941 UTC
Loc. Tortona (Alessandria, North west Italy). Mag.
3.1
The seism has happen about 80
km from my qth, SE direction. The seism moment is identified on
spectrogram with a Y on the lower part of the picture between time identification
19:40 and 19:45. They are clearly visible the net frequency of 50 Hz and
the under harmonics. They are, as well, visible various tone, connected
to signals on the electric net or to the presence of not linear loads on
it.
Even the present noise is connectable to electric
net signals, because it shows like a mirror across the 50 Hz tone and relative
harmonichs. In the spectrogram are visible some sferics and some few Hz
signals, caused by mechanical oscillation of the harms loop (like an enormous
dynamic microphone).
It's clear that there are not radio signals directly
connected with the examined seismic event.
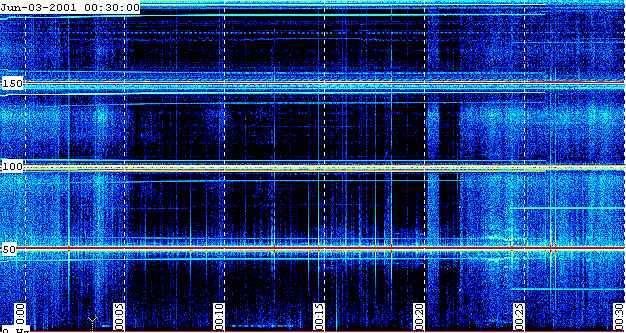
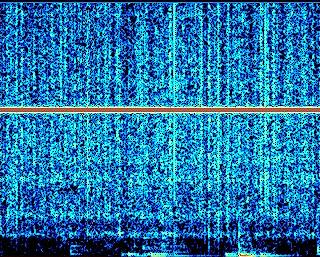
030601 0003 UTC
Genova gulf, mag 3.7.
The seism happens 170 km from my qth. The results
are the same as the example before. Signals connected to the seismic
event are not identifiable. During this earthquake I heard some glass knickknack
on the glass little table in my bedroom to tinkle.
b - SEARCH RESULTS on EARTH
DIPOLE
The earth dipoles are a kind of antenna which is
easily used for low frequency observations. They do not suffer of the mechanic
oscillation problem that gives influence the loops and the verticals, and
they have a certain directivity. It follows a two monitored episodes gotten
with a 20/20 and Spectrogram.
| 010314_070944
Ligurian sea, 200km far from me MI=3.76 |
Nothing to observe. Strong 50Hz main power tone, some statics, 60Hz Video PC carrier. |
 |
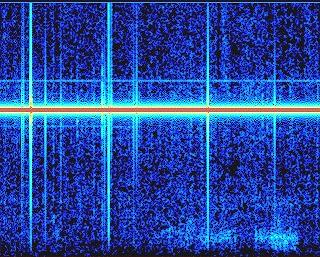 |
| MedNet Chart. My QTH at 370 km from the origin point. | 0-86 Hz / 4 min. Crack point at the centre of spectrogram |
| 010317_003007
Switzerland: 270 km far from me. |
Strong 50 Hz main power tone, some statics, 60 Hz Video PC carrier, strange noise below 15 Hz (not correlated to seismic event). |
 |
 |
| MedNet Chart. My QTH is at 150 km from the origin point. | 0-86 Hz / 4 min. Crack point at the centre of spectrogram |
Even here as in the two observed episodes with the
horizontal loop there are not radio emission connected to the seismic event.
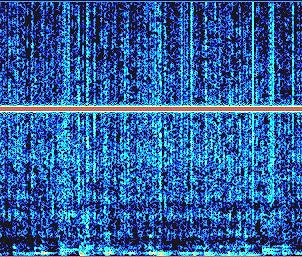
c - SEARCH RESULTS on BIG
MARCONI T ANTENNA
The two following episodes show what recorded from
the T Marconia antenna during the two seismic events. The distance is bigger
than the two preceding episodes; but in both cases the close BCI observatory
of the MEDNET net has gotten the episode. The monitoring always show a
4 mins spectrogram, with the seismic event in the centre of the picture
| 010402_085400
Tuscany, MI=2.87, 270 km far from me |
Nothing to observe. Some statics. very weak Shumann reasonances and strong 50Hz main power tone. | |
 |
 |
| 010303_015453
Central Italy
MI=3.84. 560 km far from me. |
Nothing to observe. Some statics. very weak Schumann resonances and strong 50 Hz main power tone. |
|
 |
 |
|
| MedNet Chart. My QTH at 400 km from the origin point. | 0-86 Hz / 4 min. Crack point at the centre of spectrogram |
CONCLUSIONS
Radioamatours news which talk about something during
the earthquake are many, so that we can think of a massive presence of
seismic radio emissions, but it's emblematic the fact that on the entire
web it's impossible to find a single spectrogram or an audio file containing
in a correct way these events. It's perhaps a exception of ELFRAD,
strongly engaged in this field since years, in a lower frequency band.
These simple experiences, here shown, explain, maybe this absence of data.
The signals talk by themselves: Agreeing to this
research, despite a big number of monitored episodes, there is no link
between medium intensity earthquake and radio emissions in a ray of some
thousand kilometres; in the observed frequency range from 0.5 Hz to 200
Hz. Rotten data have particular value since antenna and acquisition systems
are so much sensitive to receive the background radio noise like
for example the Marconi antenna with the Schumann resonances.
It's necessary, though, to consider that not all
grounds have the same electrical behaviour, we can so presume that there
emissions can also be strongly conditioned by material kind on which
the seismic fracture is originated.
By the same way it would be interesting to compare
there data with similar experiences done in other parts of the world.
From the done research, in the period going from
winter 2000 to spring 2001, it could be possible to say that if these radio
seismic signals exist, they are so weak that they are covered by the background
natural noise level, and so not usable for uneventual earthquake
forecasting.
From this reduced but useful research one thing
is certain: if a heartquake emits also radio emissions, as many times
shown in the laboratory, these emissions from 0.5 to 200 Hz have not no
much strength, to be easily received, even with very sensitive systems,
from a reasonable distance from the earthquake event.
So, to walk with an RS 4 receiver is not enough
to own the device which finds or forecasts the earthquake, as the same
way as a water diviner with its wood stake finds, or thinks to find
water presence in the underground. This result must not discouraging us.
What everyone of us can have at home like a PC with a Sound Blaster
card allows the extending and the deepening this research even without
any sponsor who could promote the goals.
Come on then, all these words to say that I haven't
listened anything in the short gap from 0.5 to 200 Hz, on a single kind
of ground. All the rest is to explore.
Many Thanks
to:
Andrea Bertocchi for English translate
Giuseppe Accardo for comparison tests on seismic
receptions
Wolfgang Buescher for his support with SpectrumLab
new releases