 |
CUMIANA VLF MONITORING STATION
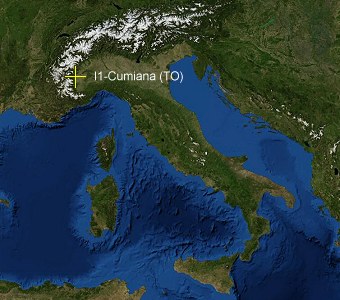
Live data from CUMIANA (TO), NW Italy, south Europe |
Lat. 44° 57’ 21,924’’ N
Lon. 7° 25’ 16,435’’ E
To see on google map click this link https://goo.gl/maps/7wviV5M8BV9T6F2A9
Electric Field monitoring with Marconi Antenna +
Geophone
The
monitoring station is located in open countryside and
consists of a Marconi antenna: a large 10 m high ‘T’
with a 15 m capacitive top.
 |
|
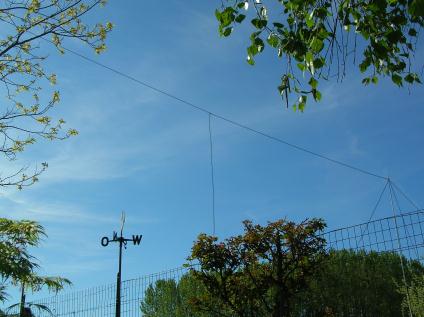 |
The antenna has a preamplifier at its
base that is remotely powered from the station. The
entire system is galvanically isolated by means of an
optical device: http://www.vlf.it/vinassa3/optical-active-isolator.html
VLF
monitoring
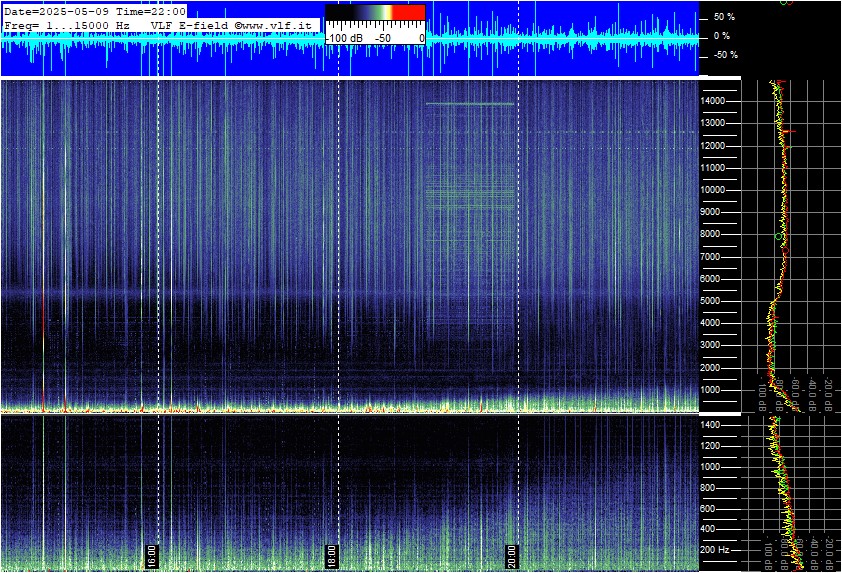
Here below the first LIVE
spectrogram, updated 30 minutes.
It shows the last 8 hours VLF
activity, as received by Marconi antenna (vertical
electric field).
Marconi Antenna + Geophone
Amplitude scale: two channels listed below.
- Channel 1, seismic monitor. Frequency range: 1 to 30 Hz for the top spectrogram. Signals coming from geophone I/O SENSOR Nederland b.v. model SM-4/UB8 (see at SM-4_Brochure.pdf) 40 dB amplified with a low noise preamplifier.
- Channel 2, electric field. Frequency range: 1 to 105 Hz for the bottom one. Signals coming from Marconi antenna, with a low noise preamplifier, placed at the bottom of it (LNVA_20-24).
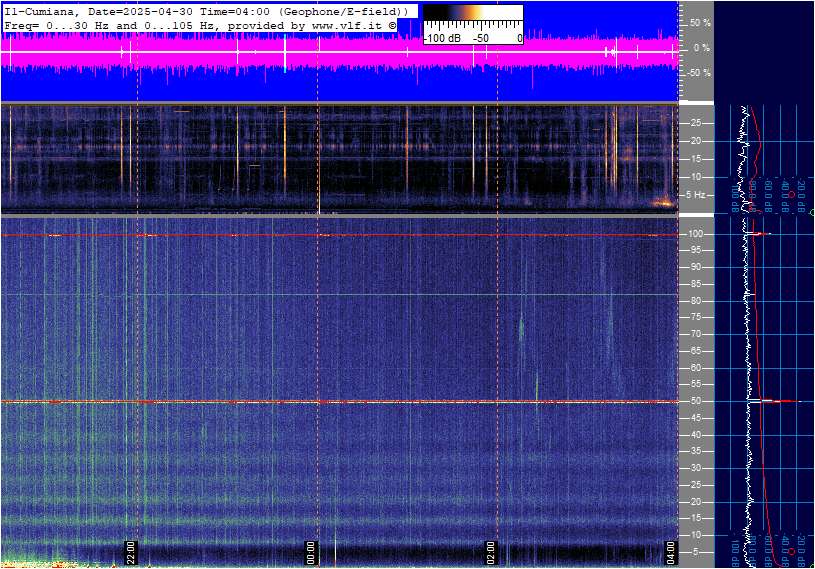
Picture, every 30 minutes, shows last
8 hours. All date and times are in UTC.
The scroll time is 40 s, and FFT
frequency resolution 21 mHz.
As the receiving station is placed not
too far from an industrial area, sometimes strong tones
are detected by geophone sensor, caused by mechanical
machine (1 km far from here).
Electric filed multistrip daily
representation, useful for comparing anomalies from day
to day:
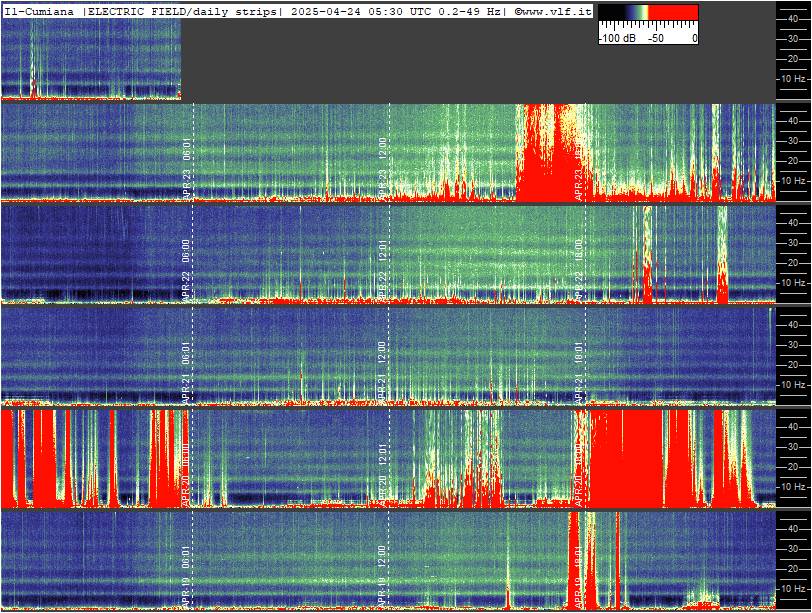
Scroll time 110 sec, updated every 30 minutes, FFT frequency resolution 10.5 mHz.
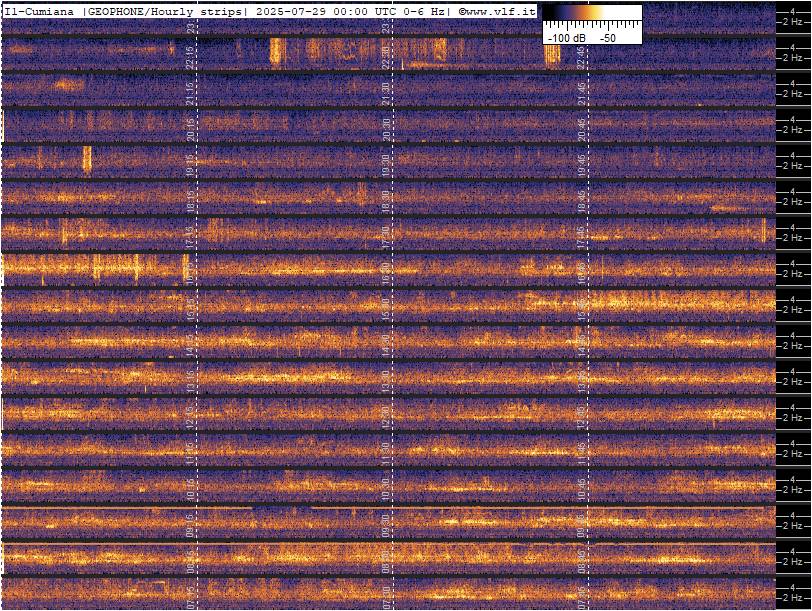
Geophone Multistrip hourly representation, useful for local seismic events correlation:
Here below the same data elaborated as plotting traces. The picture shows the last 30 hours, and values are detected every 150 s.
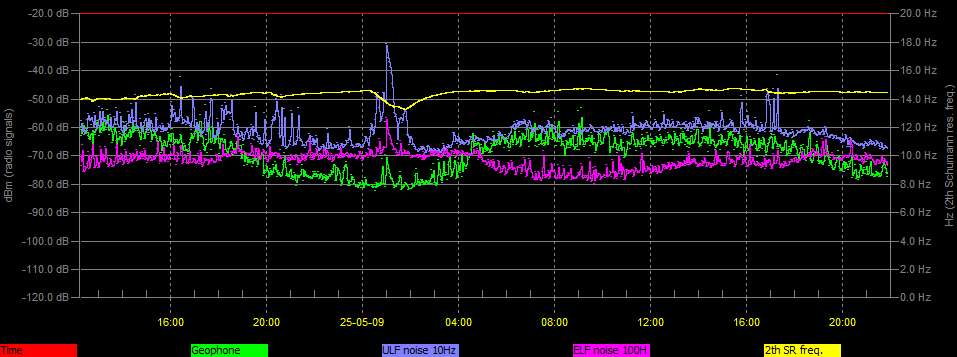
Picture, updated every 30 minutes. Four traces are reported:
- Geophone trace , it shows the average and peak signals coming from the geophone sensor, in 1-20 Hz range.
- ULF noise 10 Hz , it shows the medium value between 3 and 30 Hz.
- ELF noise 100 Hz , it shows the medium value between 30 and 300 Hz.
- 2th SR freq. , it shows the frequency of second Schumann resonance (in Hz).
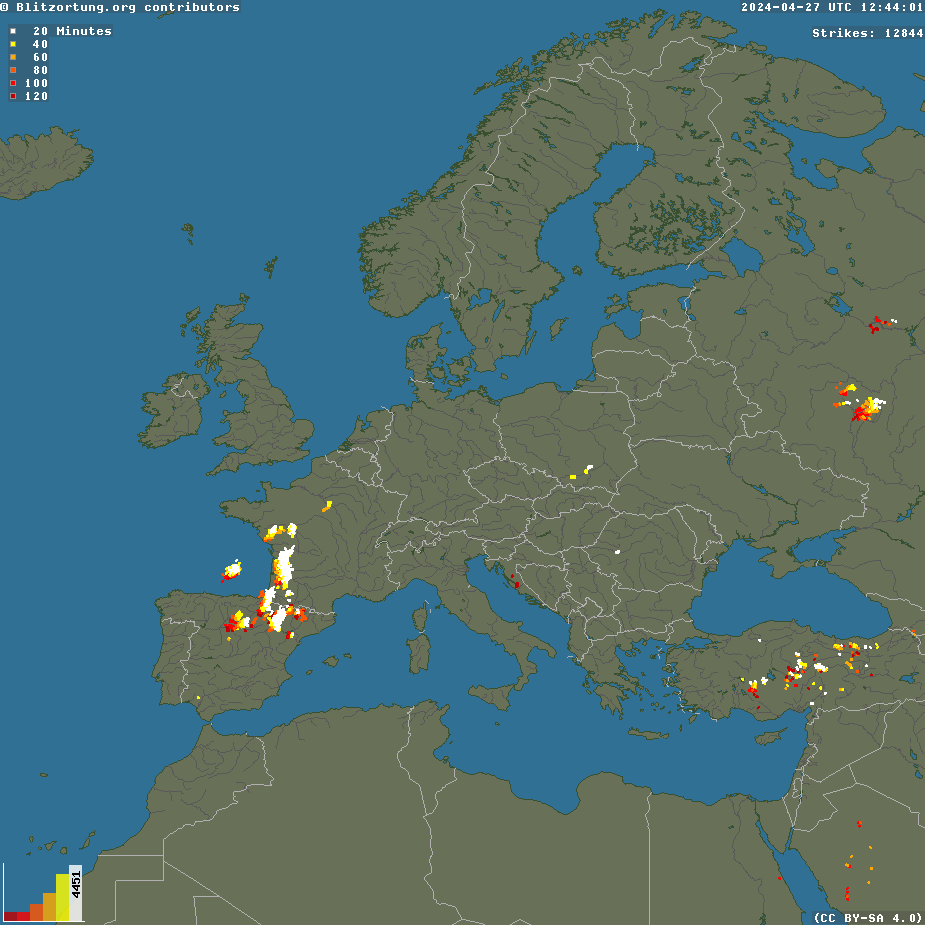
Here below the real time situation about lighting strikes in Europe. Courtesy of http://www.blitzortung.org
Unattended operations, signal
conditioning, spectrograms and RDF functions are
performed with SpectrumLab: http://freenet-homepage.de/dl4yhf/spectra1.html
. Many thanks to Wolfgang Buscher for his support.
Automatic FTP process is realized with
SyncBack Freeware V3.2.14 http://www.2brightsparks.com/downloads.html.