Live data from Medicina (IT - Bologna)
Maintained by Jader Monari & Massimo Silvestri

|
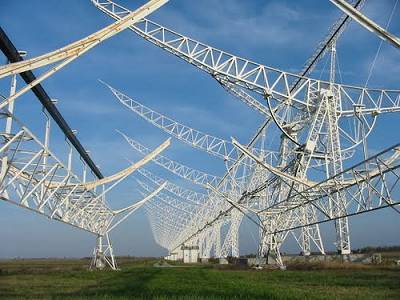
NORTHERN
CROSS RADIOTELESCOPE Live data from Medicina (IT - Bologna) Maintained by Jader Monari & Massimo Silvestri |
|
Google
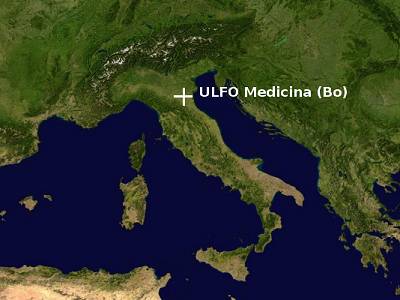
map click here http://goo.gl/maps/kYQRK
(Lat. 44°31'27.70"N - Long. 11° 38'41.97"E)
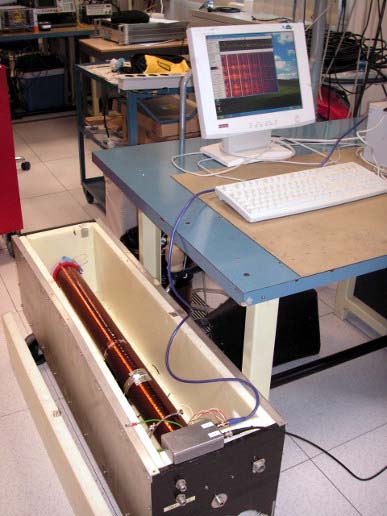
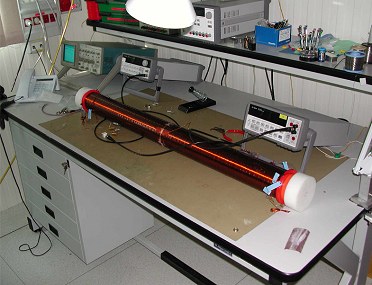
ULFO (Ultra Low Frequency Observatory) with:
ULFO Induction COIL - Magnetic field
Here the live spectrogram, updated every 15 minutes. It shows the last 8 hours ULF activity, from 0.1 to 35Hz. 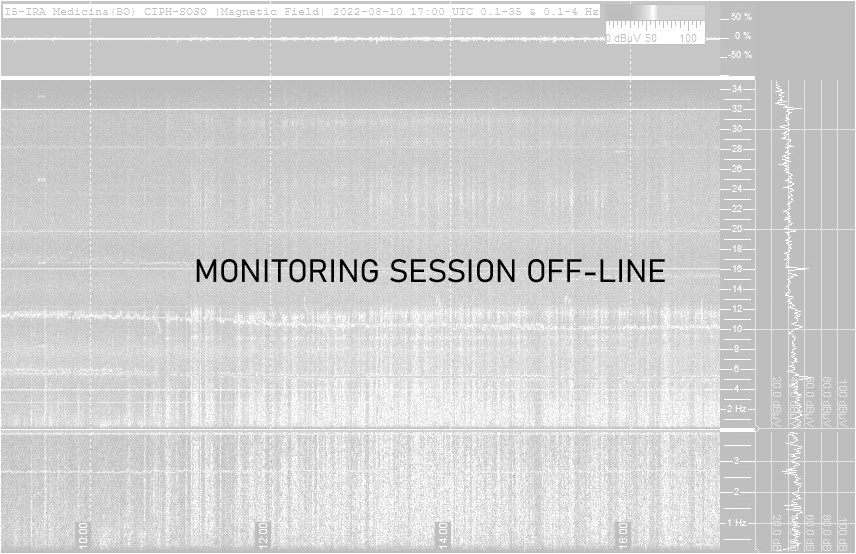 Bottom part zooms on the 0.1 to 4 Hz range. FFT resolution 21 mHz, scroll time 40 seconds. Spectrogram in 1 hour strips, from 0.1 to 35 Hz. Picture updated every 15 minutes. 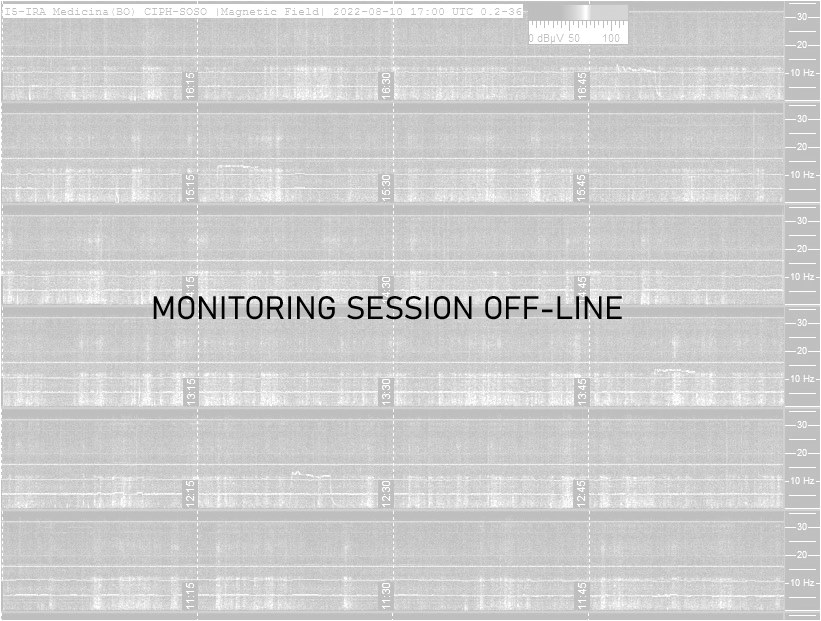 FFT resolution 84 mHz, scroll time 4.6 seconds. Multi-strip spectrogram in 1 day strips, from 0.1 to 10 Hz. Picture updated every 15 minutes. 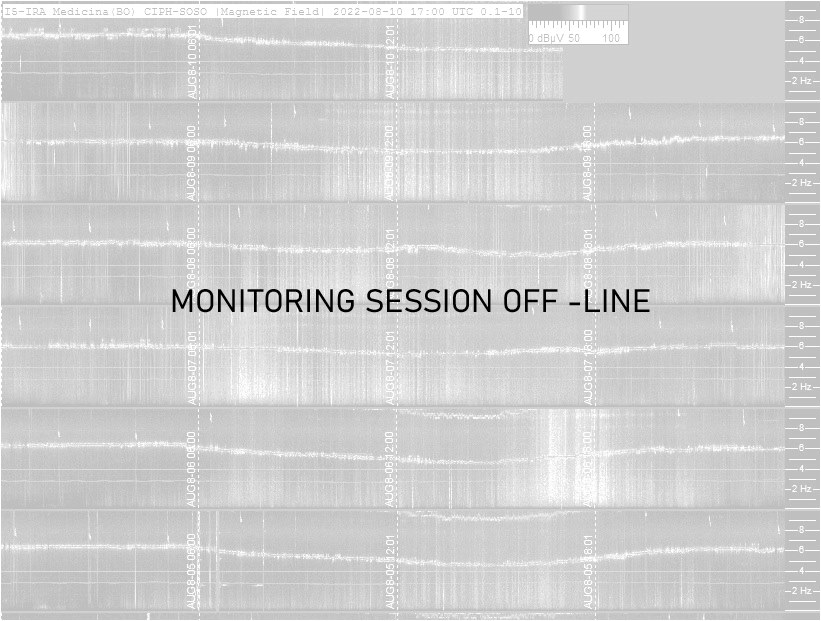 FFT resolution 21 mHz, scroll time 109 seconds. Five days monitoring interaction in the same spectrogram, from 0.1 to 35 Hz. 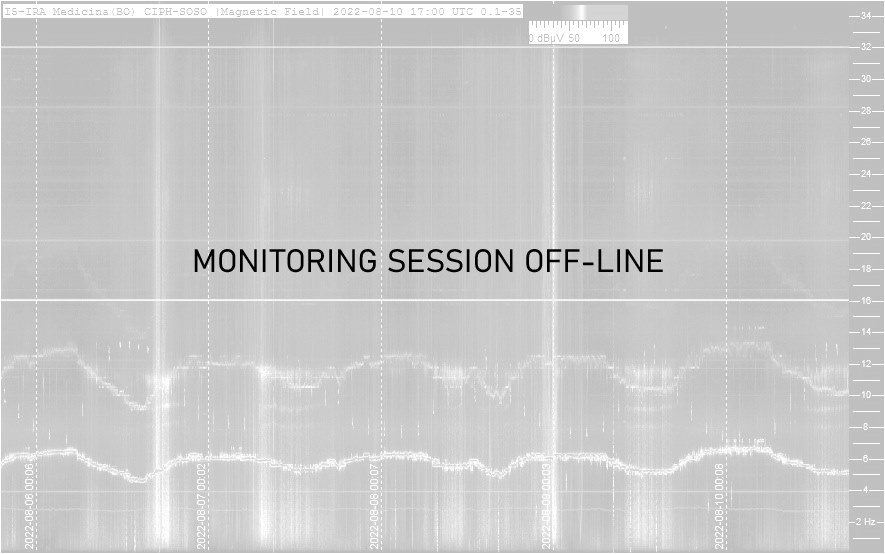
FFT resolution 42 mHz, scroll time 8.35 minutes. Geophone Multistrip hourly representation, useful for local seismic events correlation:  Scroll time 4.6 sec, updated every 60 minutes. Here below the real time situation about lighting strikes in Europe. Courtesy of http://www.blitzortung.org/

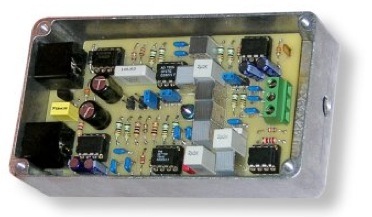
Unattended operations, signal
conditioning, spectrograms and RDF functions are
performed with Return to the index pf CIPH-SOSO.net [ULFO] Return to the index of www.vlf.it |