
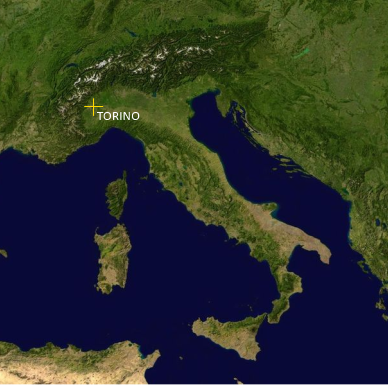
Live data from TORINO, NW Italy, south Europe
|
TORINO
VLF MONITORING STATION
Live data from TORINO, NW Italy, south Europe |
(To see on google map click this link 45.066731 N, 7.723620 E )
The web page of the observatory is
available here: http://www.sidmonitor.net
 |
|
 |
This observatory is located just outside the
city of Turin, on the hill close to it.
| System one: VLF Electric Field for SID
detecting and ELF range Aerial Marconi antenna (electric
field) with Explorer E202 receiver (http://www.vlf.it/romero2/explorer-e202.html).
Wide band VLF reception, 40 seconds
scroll time and 100 mHz frequency resolution. Picture
refreshed every minute.
Stations list taken from RDF Project
by Manfred F Kerckhoff (http://www-user.uni-bremen.de/~ews2/RDF_project.html).
For activity comparison click here to
GOES X-ray Flux plot from NOOA/SWPC Boulder (http://services.swpc.noaa.gov/images/goes-xray-flux-6-hour.gif) System two: FGM-3 Fluxgate magnetometer High sensitivity DC to 20 KHz Bandwidth magnetic field sensors (http://www.speakesensors.com/PDF/detail.pdf) The sensor is buried in the ground at one meter depth to keep it thermally stable. Placed horizontally it is oriented 90 ° East and its output signal (about 90 kHz) is divided for 8 to obtain a final frequency to entering the sound card range (here at about 13 kHz). The frequency deviation is proportional to DC magnetic field variation (blue tones spectrogram). FM demodulated signal returns instead the AC magnetic field spectrogram (green tones one). Fluxgate Magnetometer, frequency plot:  It shows the output frequency after mixing with the local oscillator Pictures are updated every 5 minutes. System three: ICS101 Induction coil  FFT resolution 10,5 mHz, scroll time 40 seconds. Schumann resonances are always visible: when not covered by local noise. Picture updated every 30 minutes. The spectrogram part below, 0.1 to 4 Hz, it is good for the PC1 detection. Multistrip daily representation, useful for comparing anomalies from day to day:  Scroll time 110 sec, 7 mHz resolution, updated every 30 minutes. |
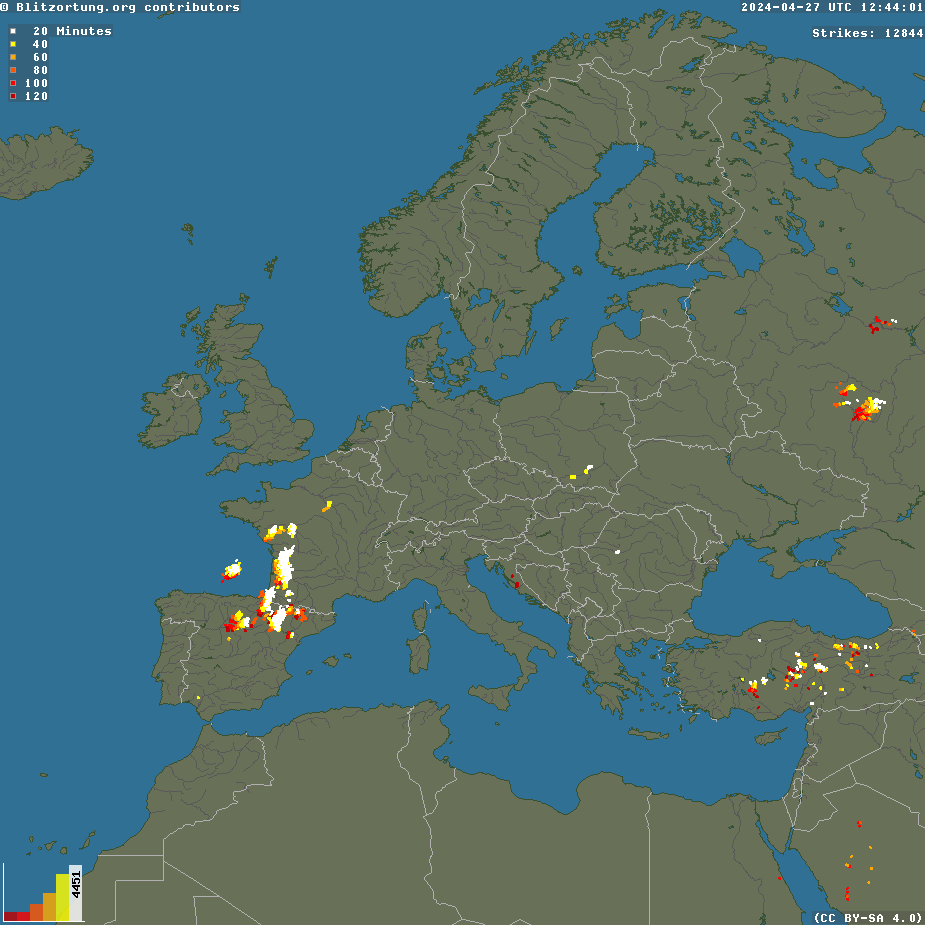
Here below the real time situation about lighting strikes in Europe. Courtesy of http://www.blitzortung.org
Unattended operations, signal conditioning,
spectrograms and RDF functions are performed with SpectrumLab: http://freenet-homepage.de/dl4yhf/spectra1.html
. Many thanks to Wolfgang Buscher and Paul Nicholson for
support.

