and Super Accurate VLF Measurements
By Alessandro VINASSA
Have you ever tried using a VLF receiver in the garden and connecting its signal to your PC at home with an audio cable? If so, you must have noticed a big problem: the cable carrying the signal from the receiver to the PC also carries noise from the PC and the home network back to the receiver. The result? A disaster: the receiver that worked reasonably well on batteries with headphones in your backyard becomes unusable when connected to the PC with a cable: you mostly receive network hum.
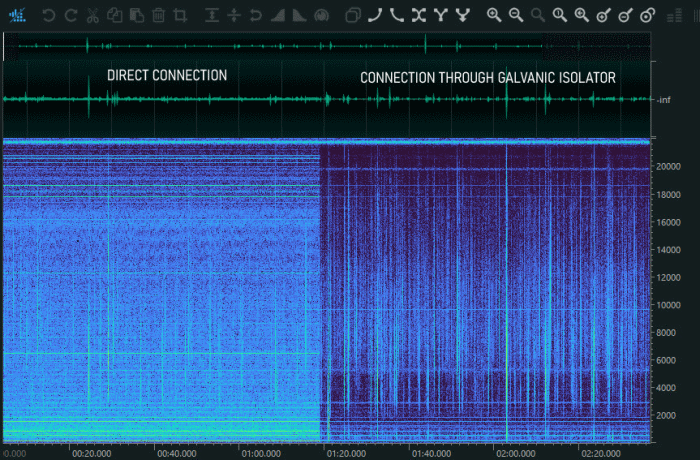
How can you solve this problem? You need to galvanically isolate the receiver from the PC, which means breaking the metallic continuity to interrupt the so-called "ground loop." In this article, we explain technically what a ground loop is and the circuit solutions that can solve the problem. In the following picture you can see a spectrogram taken using a VLF receiver with and without a ground isolator. The difference is obvious and striking.
Figure
1: on the left: direct connection between receiver
and PC powered by main.
On the right: a galvanic isolator is used to connect receiver and PC, reproducing the conditions of a stand-alone receiver.
On the right: a galvanic isolator is used to connect receiver and PC, reproducing the conditions of a stand-alone receiver.
On the left, the signal is overwhelmed by the main line frequency (50Hz) and related harmonics and noise. On the right, the noise disappears, allowing the useful signal to come through clearly. You can download these two recordings in MP3format here: Audio sample. All of this is achievable with a simple and easily buildable device: a perfect weekend project!
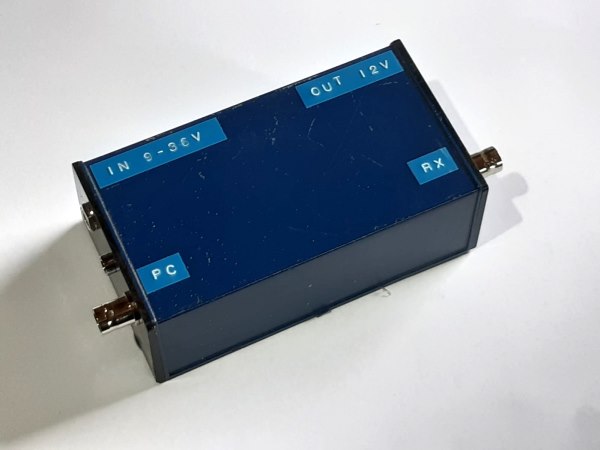
Figure 2:
The complete homemade Isolator
What is a
ground loop?In an electrical system, a ground loop or earth loop occurs when two nodes of a circuit are intended to have the same ground reference potential but, instead, they have a different potential between them. This is typically caused when enough current is flowing in the connection between the two ground points to produce a voltage drop and therefore cause the two points to be at different potentials. Current may also be produced in a circular ground connection (ground loop) by electromagnetic induction.
In low-level measurement applications, such as in VLF experiments, electronics, or sensitive audio/video equipment, ground loops can be particularly problematic and potentially dangerous. Here's why:
1. Interference: Ground loops can act as antennas, picking up electromagnetic interference (EMI) from the surrounding environment. This interference can manifest as unwanted signals or noise in the measurement, making it difficult to distinguish the desired signal from the noise.
2. Safety Hazards: In certain situations, ground loops can lead to safety hazards. For example, if there is a significant potential difference between two grounded points in a system, touching both points simultaneously could result in an electrical shock. This is especially concerning in applications where human safety is paramount.
To mitigate the dangers of ground loops in low-level measurements, the most used strategy is isolation. Isolation techniques involve using components or devices that galvanically separate different parts of a circuit or system. For example, opto-isolators or transformers can be used to isolate signals and break ground loops. The isolation solution is historically used in VLF. On this site, for example, there is a detailed description of a Marconi antenna which treats also the theme of galvanic isolation (see at http://www.vlf.it/romero2/explorer-e202.html the paragraph STYLUS ANTENNA AND GROUND REFERENCE). It suggests the following:
"It is necessary, in this case, to isolate the signal line, interrupting the metal continuity. This requires the use of a 1:1, 600 ohm audio transformer, to connect the receiver to the PC with galvanic isolation."
In this article we will analyse a low-cost transformer, then we will develop a practical circuit to exploit the transformer to its full potential. This circuit will be simple but not trivial and will be easily adapted to the needs of all experimenters, since it will be explained in detail how it is calculated based on the specifications.
But before going on with the description of our, let’s do some testing on a cheap audio transformer to compare it with our design.
The Audio Transformer
We will now speak about the problems related to the bandwidth and the distortion in an audio transformer. We will use as example a DynaVox ground loop isolator purchased on Amazon for 20€. It is a cheap transformer, but it should be useful to emphasize all the problems that this technology has.
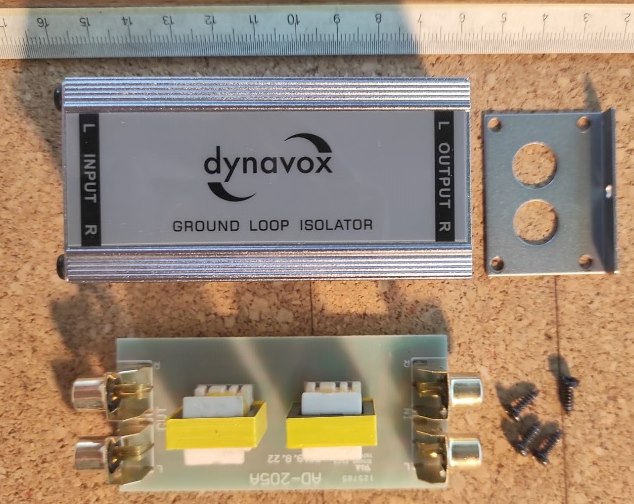
Figure 3: the audio transformer under test
In Figure 3 you can
see a photo of the audio transformer. It is a 1:1 600Ω
transformer. Its DC resistance is near 150Ω and its
inductance is approximately 0.4H. Now let’s start on
the main unwanted guest at this party: distortion.
In a transformer, the signal (which indeed means the energy) is transferred from primary to secondary by the magnetic flux that is confined inside the windings by the ferromagnetic core. This flux is directly proportional to the integral of the input voltage across the primary. Considering a sine wave, its flux (or integral, whatever you prefer) is null in the period but reaches a maximum in the half of the period. This maximum is directly proportional to both the peak value of the sine and the period. For this reason, a sinewave of 100mV at 10Hz requires a magnetic flux 100 times greater than the same sinewave at 1kHz.
Unfortunately, the ferrite core cannot handle infinite flux because it has a non-linear behaviour. For sake of brevity, it is possible to state that, in a transformer, the higher the flux, the greater the distortion. This fact directly implies that the lower the frequency, the greater the distortion. The following image shows what we have just discussed. Using the same scale, it represents the THD+Noise voltage level in dBV (the continuous line) and transformer’s output voltage (the dashed line), the difference between the output level and the THD level represents the Total harmonic distortion of the transformer under test. For example, for a 1V input, the THD at 200Hz is -55dBc, while at 20Hz it is near -27dBc. To make this measurement the transformer is directly connected to a 50Ω source while its secondary winding is loaded by 1MΩ termination.
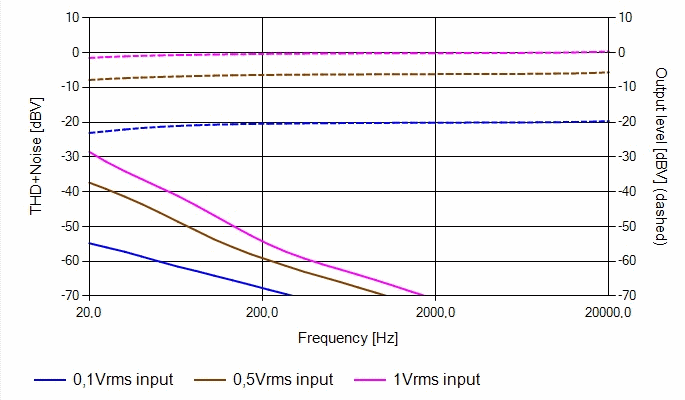
Figure 4 - Transformer THD evaluation in frequency.
In a transformer, the signal (which indeed means the energy) is transferred from primary to secondary by the magnetic flux that is confined inside the windings by the ferromagnetic core. This flux is directly proportional to the integral of the input voltage across the primary. Considering a sine wave, its flux (or integral, whatever you prefer) is null in the period but reaches a maximum in the half of the period. This maximum is directly proportional to both the peak value of the sine and the period. For this reason, a sinewave of 100mV at 10Hz requires a magnetic flux 100 times greater than the same sinewave at 1kHz.
Unfortunately, the ferrite core cannot handle infinite flux because it has a non-linear behaviour. For sake of brevity, it is possible to state that, in a transformer, the higher the flux, the greater the distortion. This fact directly implies that the lower the frequency, the greater the distortion. The following image shows what we have just discussed. Using the same scale, it represents the THD+Noise voltage level in dBV (the continuous line) and transformer’s output voltage (the dashed line), the difference between the output level and the THD level represents the Total harmonic distortion of the transformer under test. For example, for a 1V input, the THD at 200Hz is -55dBc, while at 20Hz it is near -27dBc. To make this measurement the transformer is directly connected to a 50Ω source while its secondary winding is loaded by 1MΩ termination.

Figure 4 - Transformer THD evaluation in frequency.
The previous
plot shows the behaviour of the transformer in
audio bandwidth: the transformer under test, even
if it is very cheap, seems to work quite well in
audio! But what does it happen in the SUB-audio
band? Well, from the plot we can see that lowering
the frequency, the distortion increases. The
following figures show the output of the 50Ω
loaded transformer with a 0.5Vrms sinewave at the
frequency of 20,5 and 1Hz.
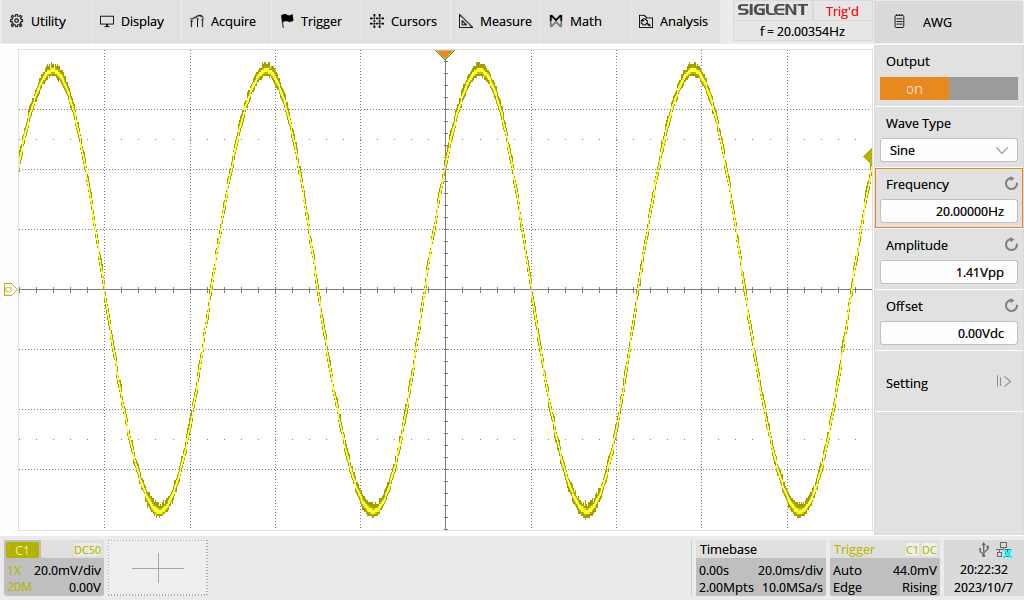
Figure 5: 0.5Vrms-20Hz into a transformer: no visible distortion
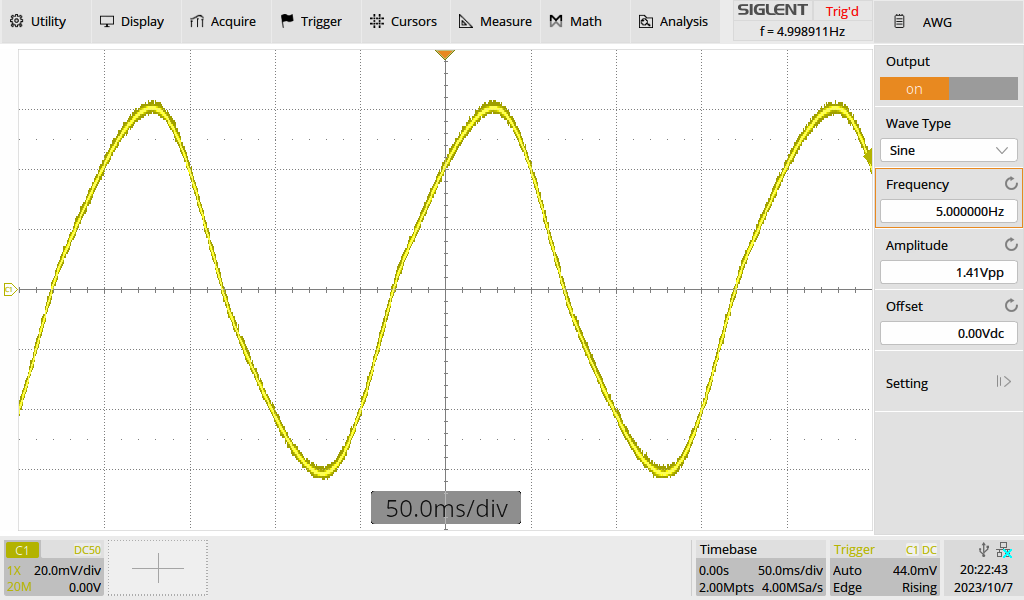
Figure 6:0.5Vrms-5Hz into a transformer: little distortion
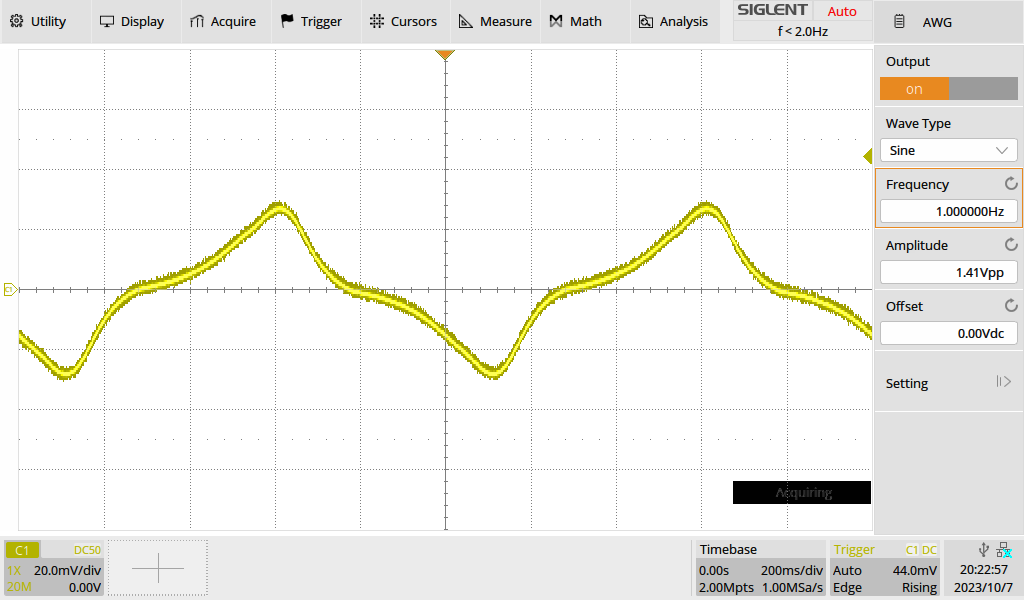
Figure 7: 0.5Vrms-1Hz into a transformer: huge distortion
Even without making an instrumental analysis of the distortion, it is quite clear that it increases lowering the frequency. As a result, the system cannot be used under 10Hz. It is highly recommended to cut this lower frequencies, because, in case of strong, sub-audio signals, they can produce a momentaneous saturation of the nucleus, causing a heavy intermodulation distortion. Intermodulation distortion is always ongoing, at any input level and any input frequency.
In the Figure 8 it’s possible to visualize the intermodulation distortion. With a vectorial signal generator, we have produced a two-tone signal. Firstly, we connected it directly to the audio soundcard. The results in the magenta trace: we can see two signals at -24dB, one at 50Hz, an another at 222Hz. The noise floor is completely spurious free, except for the harmonic components of the signal which barely emerge from the noise floor. Let’s say that the SFDR (spurious free dynamic range) in this case is 70dBc.
In blue trace we have added our cheap transformer between the soundcard and the generator: a jungle of spurious signals is born in the floor and the SFDR is more or less 36dBc.
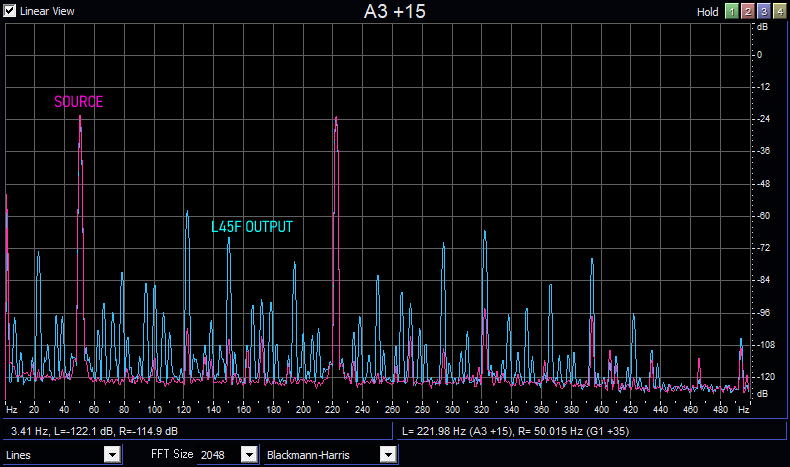
Figure 8: Two tone signal directly feed into audio soundcard (magenta trace) or through the cheap transformer (magenta trace)
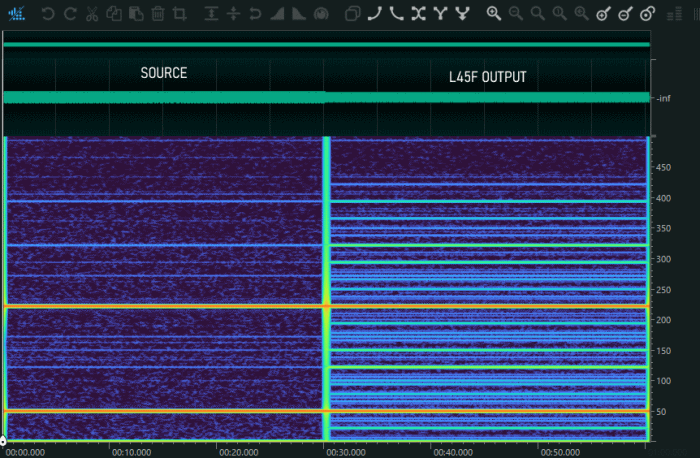
Figure 9: : Two tone signal directly feed into audio soundcard (left side) or through the cheap transformer (right side)
If we are used to
working with spectrograms, we can observe the effects
of intermodulation on them in Figure 9. On the left,
you can see dozens of non-existent lines that
shouldn't actually be there. A reception this streaked
makes interpreting the graph much more complex.
It is really hard to understand the nature of every spurious signal in Figure 9. For example, we can see a 22Hz down to the left. Which is made from the difference between the 4th harmonic of 50Hz and the 222Hz (4∙50Hz-222Hz=22Hz), or a 122Hz that can be generated from the sum between the 2th harmonic of 50Hz and the 22Hz (2∙50Hz-22Hz=122Hz). In fact, even the tones generated by intermodulation can intermodulate between themselves generating this wild forest.
Let’s now move to the bandwidth. As previously explained, the reception of the sub-audio band is a must for a complete reception of the electric field. The transformer must be connected between the preamplifier and the audio card. The audio card, normally, offers a high input impedance. In these conditions the transformer is driven by a low impedance source (50Ω) and is loaded by, let me say, an open circuit. The transfer function of this system is show in the following figure:
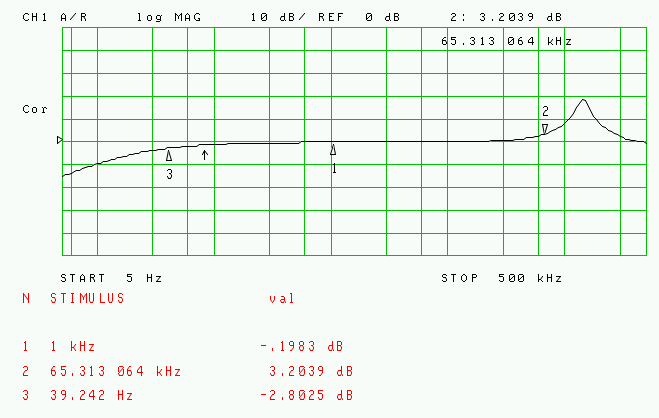
The gain is unitary, the band is very wide and could be extended with a correct damping of the high frequency resonance. This can be done adding a RC snubber in parallel with the secondary side. The value of these two components has to be found experimentally. A good starting point can be 2.7nF and 560Ω. The low frequency corner it’s not that great: 39Hz. This, along with distortion, is the major limitation of the circuit. But these characteristics of the economical transformer do not, however, rule out its use.
When used at voice frequencies, from 300 to 3000 Hz (ULF), the phenomenon of intermodulation is less noticeable, and the economical transformer can still provide great advantages. Natural radio signals such as static, tweaks, whistlers, and chorus can be successfully received, with a level of quality and noise immunity that cannot be achieved without the use of a galvanic isolator.
However, when used with extremely low-frequency signals, below 300 Hz (ELF), where the intermodulation phenomenon is more intense, the problem can be significant: for example, when receiving geomagnetic pulsations at 0.5 Hz, Schumann resonances at a few tens of Hz, or ZEVS signals at 82 Hz, the transformer creates signals that do not exist. In these contexts, the use of a professional product is necessary.
That said, keeping in mind the limitations of the economical transformer, it can still be used. But if we wanted a device with significantly better performance in terms of bandwidth and distortion, what steps could we take?
We have only one option: change the transformer. The performance of the isolator is linked to the quality of the transformer, regardless of the driving circuit used. Once a good device with professional characteristics is chosen, circuit techniques can be employed to make the most of it. For this reason we will focus now on the isolation transformer A262A2E produced from OEP. You can purchase it on RS for 20€. It is a component with precise and well-defined characteristics, with a well-made and professional datasheet. It is a repeatable product, meaning that every time you purchase it, you can be sure of receiving the same device.
At this point, to extend the low frequency response we have to do some electronic magic stuff, but first it is important to understand where this low frequency limit comes from.
It is really hard to understand the nature of every spurious signal in Figure 9. For example, we can see a 22Hz down to the left. Which is made from the difference between the 4th harmonic of 50Hz and the 222Hz (4∙50Hz-222Hz=22Hz), or a 122Hz that can be generated from the sum between the 2th harmonic of 50Hz and the 22Hz (2∙50Hz-22Hz=122Hz). In fact, even the tones generated by intermodulation can intermodulate between themselves generating this wild forest.
Let’s now move to the bandwidth. As previously explained, the reception of the sub-audio band is a must for a complete reception of the electric field. The transformer must be connected between the preamplifier and the audio card. The audio card, normally, offers a high input impedance. In these conditions the transformer is driven by a low impedance source (50Ω) and is loaded by, let me say, an open circuit. The transfer function of this system is show in the following figure:

Figure
10: unloaded transformer gain plot
The gain is unitary, the band is very wide and could be extended with a correct damping of the high frequency resonance. This can be done adding a RC snubber in parallel with the secondary side. The value of these two components has to be found experimentally. A good starting point can be 2.7nF and 560Ω. The low frequency corner it’s not that great: 39Hz. This, along with distortion, is the major limitation of the circuit. But these characteristics of the economical transformer do not, however, rule out its use.
When used at voice frequencies, from 300 to 3000 Hz (ULF), the phenomenon of intermodulation is less noticeable, and the economical transformer can still provide great advantages. Natural radio signals such as static, tweaks, whistlers, and chorus can be successfully received, with a level of quality and noise immunity that cannot be achieved without the use of a galvanic isolator.
However, when used with extremely low-frequency signals, below 300 Hz (ELF), where the intermodulation phenomenon is more intense, the problem can be significant: for example, when receiving geomagnetic pulsations at 0.5 Hz, Schumann resonances at a few tens of Hz, or ZEVS signals at 82 Hz, the transformer creates signals that do not exist. In these contexts, the use of a professional product is necessary.
That said, keeping in mind the limitations of the economical transformer, it can still be used. But if we wanted a device with significantly better performance in terms of bandwidth and distortion, what steps could we take?
We have only one option: change the transformer. The performance of the isolator is linked to the quality of the transformer, regardless of the driving circuit used. Once a good device with professional characteristics is chosen, circuit techniques can be employed to make the most of it. For this reason we will focus now on the isolation transformer A262A2E produced from OEP. You can purchase it on RS for 20€. It is a component with precise and well-defined characteristics, with a well-made and professional datasheet. It is a repeatable product, meaning that every time you purchase it, you can be sure of receiving the same device.
At this point, to extend the low frequency response we have to do some electronic magic stuff, but first it is important to understand where this low frequency limit comes from.

Figure 11:
a transformer connected to a 50Ω source
In Figure 11 we can see a transformer connected to a 50Ω source. The source output resistance makes a voltage divider with the transformer’s primary side: lowering the frequency the impedance of the transformer decreases, together with the voltage across it. This forms the low frequency pole. The value of this frequency is:
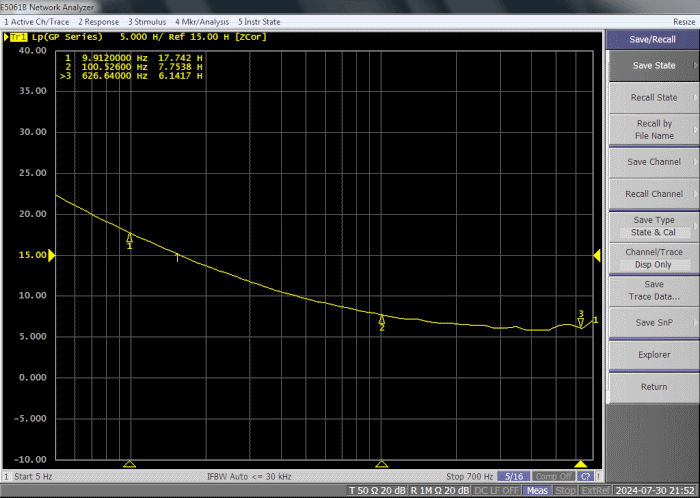
Figure 12:
Inductance in Henry of the A262A2E transformer measured
with Keisight E5061B
We understood that the low frequency corner is caused from the voltage divider between the primary inductance and the source and parasitic resistance. How can we lower it? The only approach is to decrease the source impedance.
This is not always easy because the transformer is usually driven by an op-amp which can be unstable with huge reactive load. The presence of a resistance in series to the amplifier output is the easiest method to keep it stable. But there is an elegant solution to extend down the bandwidth: close the secondary side of the transformer on a short circuit and read the secondary current instead of the secondary voltage. I decided to analyse mathematically this circuit in the following chapter. If someone doesn’t want to have a complete explanation of this circuitry, he can skip the following chapter.
A litte note, There is also another possible approach: you could place a negative resistance in series to the primary to cancel out the winding resistance. This technique would also compensate for the transformer's distortions. However appealing and theoretically perfect, this negative impedance driver has many practical disadvantages that make it difficult to use. If this topic interests you, let us know, and we’ll try to explore this path, even if just for fun and academic purposes!
Let’s do some math
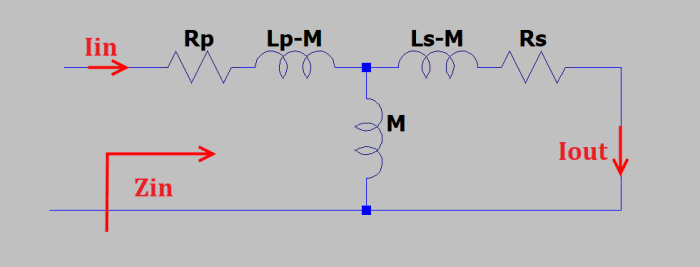
First of all, it is important to remember the Star equivalent of the transformer:
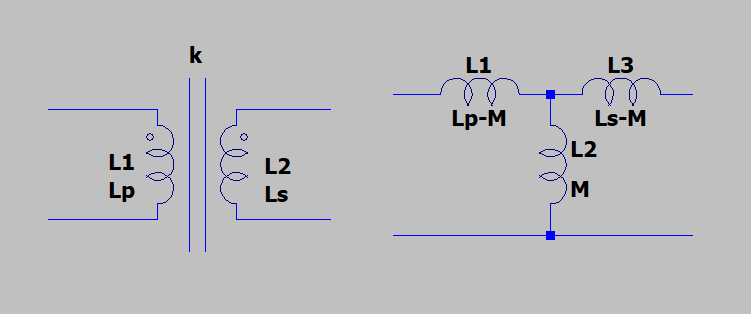
Figure 13: Equivalent circuit of the transformer
Let’s consider a transformer with primary inductance L_p, secondary inductance L_s and coupling factor k. In Figure 13 we can see its equivalent circuit. M is the mutual inductance and can be evaluated using the formula:
In a transformer k, the coupling factor, is near 1. For example, it could be 0.9999 or something similar. Therefore M≈√(L_p L_s ). The real transformer has also a winding resistance, that can be modelled with two resistors R_p and R_s placed in series to L1 and L3
Now let’s place a short circuit on the secondary side.
This result is interesting: the low frequency corner is now:
No dependency on the load (which is a short), no dependency on the source. This circuit exploits the transformer as much as possible, up to its own limit determined from the DC resistance and the inductance of the secondary.
The in-band gain of the system is found looking at the limit of Iout for sLs much greater than Rs (high frequency).
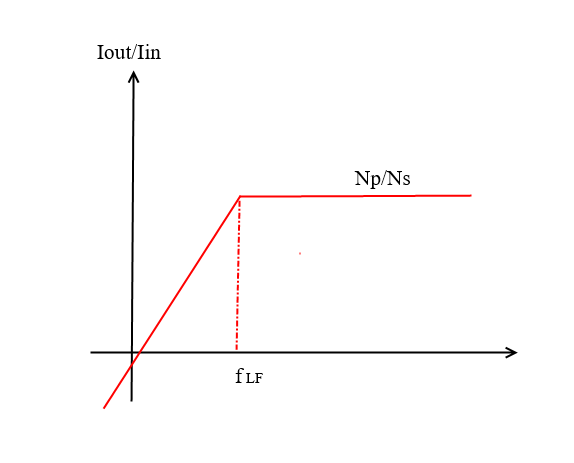
Figure 14: frequency response of the shorted transformed with current drive
But
how to feed the current into the primary? An active
current source? It can be done in an easier manner.
Let’s calculate Zin.
But remembering that k≈1 and
therefore M = k√(Lp Ls ) ≈ √(Lp Ls ),
after a bit of math:

It represents an impedance which value is Rp
for frequency smaller than fz, and Rp + Lp / Ls *
Rs for frequencies larger than fp. Since
fp is equal to fLF that is our low frequency
corner, we have to stay above it. Thus, the in-band
input impedance of the shorted transformer is a
resistance of value Rp + Lp / Ls * Rs. Since it is
inconvenient to measure the inductance, it is useful
write this equation using the turn ratio. Therefore,
the in-band input resistance is also equal to Rp +
(Np / Ns )^2 * Rs. We can go back to the
original question: How can I inject current in the
shorted transformer? Well, since its input impedance
is a resistance, it can be done by simply connecting
a voltage generator to it!
Now we have all the elements to complete the circuit!
This equation has 1 pole
and 1 zero:


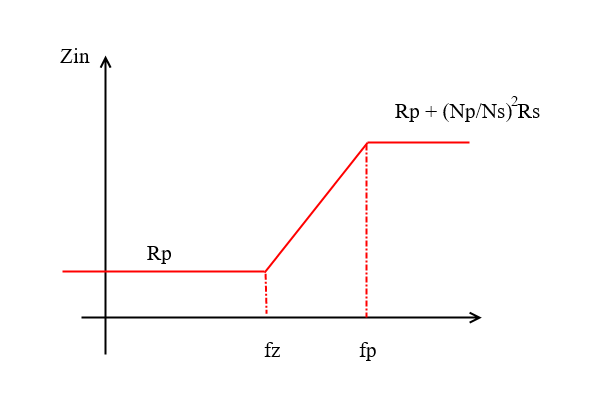
Figure 15: Zin trend as frequency varies

Figure 15: Zin trend as frequency varies
Now we have all the elements to complete the circuit!
A real, professional application: the
design
In Figure 16 we can see the complete circuit. It is very simple: it has single supply, and it does not require power on the primary side: the active components are mounted only in the “secondary side” of the circuit. The supply voltage can vary from 9V to 30V.
On the secondary side we can see that the winding is connected across the two inputs of the operational amplifier U1. Since in an op-amp the negative input follows the positive one, the voltage across the winding is zero, that means it is shorted from a virtual ground. The current produced from the winding is conduced into R4, which provide gain. U2 simply generates a voltage reference at half supply. We know that the input impedance of the shorted transformer is a resistor. R1 determines the total input impedance of the circuit and, together with the transformer’s input resistance and the source resistance, it transforms the input voltage into current. This is a little drawback of this topology: because the input impedance of this circuit is non-infinite, the source resistance affects the gain of the stage. R2 is a current limiting/stabilizing resistor and C2 removes the offset voltage from the signal.
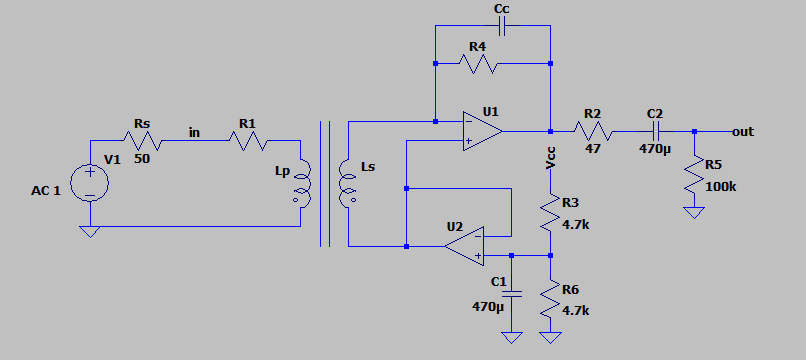
Figure 16: Complete Circuit
In Figure 16 we can see the complete circuit. It is very simple: it has single supply, and it does not require power on the primary side: the active components are mounted only in the “secondary side” of the circuit. The supply voltage can vary from 9V to 30V.
On the secondary side we can see that the winding is connected across the two inputs of the operational amplifier U1. Since in an op-amp the negative input follows the positive one, the voltage across the winding is zero, that means it is shorted from a virtual ground. The current produced from the winding is conduced into R4, which provide gain. U2 simply generates a voltage reference at half supply. We know that the input impedance of the shorted transformer is a resistor. R1 determines the total input impedance of the circuit and, together with the transformer’s input resistance and the source resistance, it transforms the input voltage into current. This is a little drawback of this topology: because the input impedance of this circuit is non-infinite, the source resistance affects the gain of the stage. R2 is a current limiting/stabilizing resistor and C2 removes the offset voltage from the signal.

Figure 16: Complete Circuit
To correctly
design this stage, we must decide some
specifications. Of course, everyone can choose the
characteristics they believe in!
On the other hand, here is the data necessary for sizing:
The inductance could be useful to evaluate the low frequency corner, but, as previously described, it strongly depends on frequency and its value near the low frequency side is never specified. So, the best approach is to verify the low frequency corner to have an approximate idea, and then measure it. The real pole could be also a decade lower than the analytical result!
Feel free to experiment with the circuit using any transformer and measure the performance obtained. For example, you can use a power transformer with two secondary windings. A 230V input and 15V+15V output transformer can be employed by using the two 15V windings as primary and secondary with a 1:1 winding ratio and leaving the 230V winding disconnected. Of course, the results are not guaranteed, but it could be a good way to have some fun while waiting for the professional transformer to arrive.
These are the equation useful for the design:


- Input resistance Rin . To keep the noise low is important to choose a small value: 600 Ω should be perfect, because can be driven from all the operational amplifiers. If you want, you can increase or decrease it. A too low value can cause too much current in the primary and can bring to transformer saturation.
- Gain G: we decide to have unitary gain
- Bandwidth fp: 10 kHz. Of course, it must be lower than the high frequency corner of the transformer.
On the other hand, here is the data necessary for sizing:
- Transformer turn ratio Np/Ns
- DC resistance of the winding Rs and Rp.
The inductance could be useful to evaluate the low frequency corner, but, as previously described, it strongly depends on frequency and its value near the low frequency side is never specified. So, the best approach is to verify the low frequency corner to have an approximate idea, and then measure it. The real pole could be also a decade lower than the analytical result!
Feel free to experiment with the circuit using any transformer and measure the performance obtained. For example, you can use a power transformer with two secondary windings. A 230V input and 15V+15V output transformer can be employed by using the two 15V windings as primary and secondary with a 1:1 winding ratio and leaving the 230V winding disconnected. Of course, the results are not guaranteed, but it could be a good way to have some fun while waiting for the professional transformer to arrive.
These are the equation useful for the design:

Let us
design the stage using the isolation
transformer A262A2E produced from OEP.
Here it is a datasheet extract:
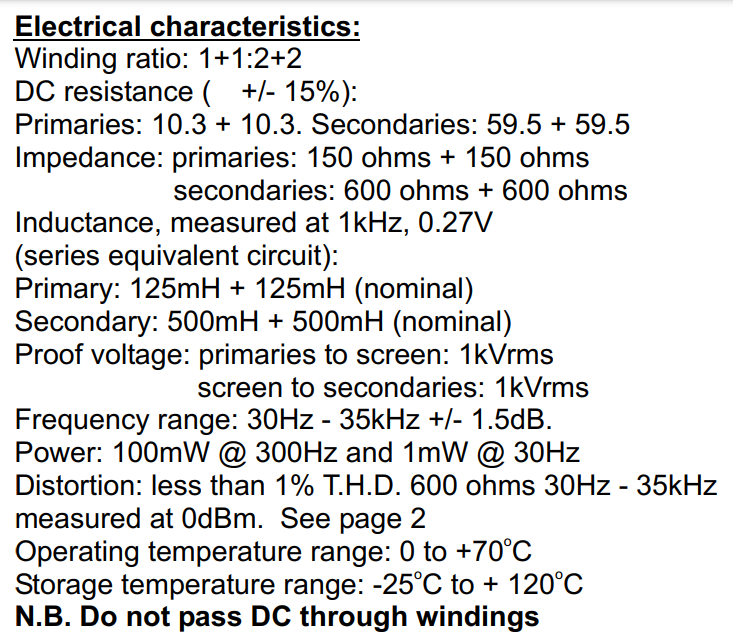
The primary and the secondary windings are divided in two. We will connect them in series. The useful parameters are:
And then the calculations:


As you can see, the calculations are easy. And this topology is quite flexible. Now let’s mount this circuit on breadboard and let’s measure it!

The primary and the secondary windings are divided in two. We will connect them in series. The useful parameters are:
- Np/Ns = (1+1)/(2+2) = 1/2 = 0.5
- Rs = 59.5Ω + 59.5Ω = 119Ω
- Rp = 10.3Ω + 10.3Ω = 20.6Ω
And then the calculations:

As you can see, the calculations are easy. And this topology is quite flexible. Now let’s mount this circuit on breadboard and let’s measure it!
Breadboarding the circuit
The circuit is not critical and can be assembled with almost all operational amplifiers. I tested the LM833 and TL072 and both works without problems. In Figure 17 you can see the complete circuit.
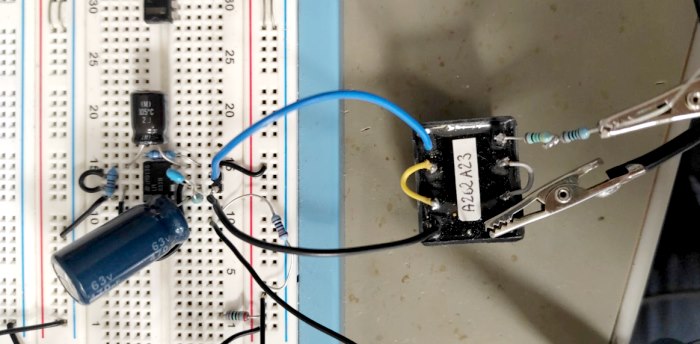
The circuit is not critical and can be assembled with almost all operational amplifiers. I tested the LM833 and TL072 and both works without problems. In Figure 17 you can see the complete circuit.

Figure 17: the breadborded
circuit
Firstly, we can
measure the bandwidth. In Figure 18 we can see the
high frequency response. We expect a high frequency
pole a little higher than 10kHz because we use a 10nF
capacitor instead of 13nF. The closure pole, indeed,
is at 11.8kHz. The in-band gain is unitary and at 5Hz
the low frequency pole is barely guessable. This is
very interesting: according to the math (and confirmed
with Spice), the low frequency corner should be:
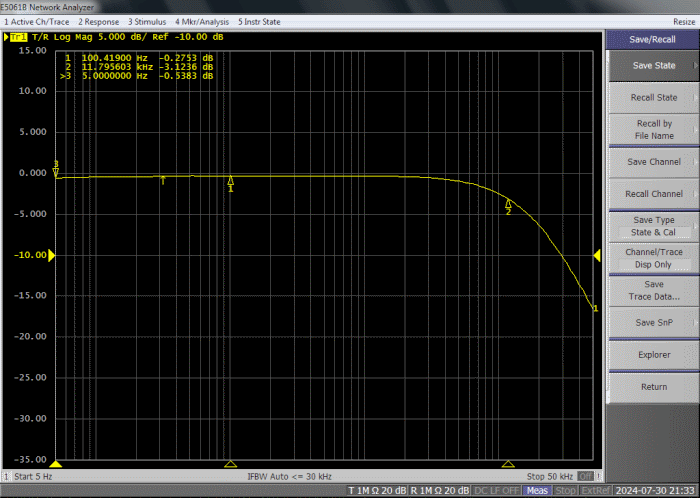
Figure 18:
bandwidth of the prototype
Since I haven’t got a network analyser working under 5Hz, I traced the low frequency response manually, with oscilloscope and signal generator.
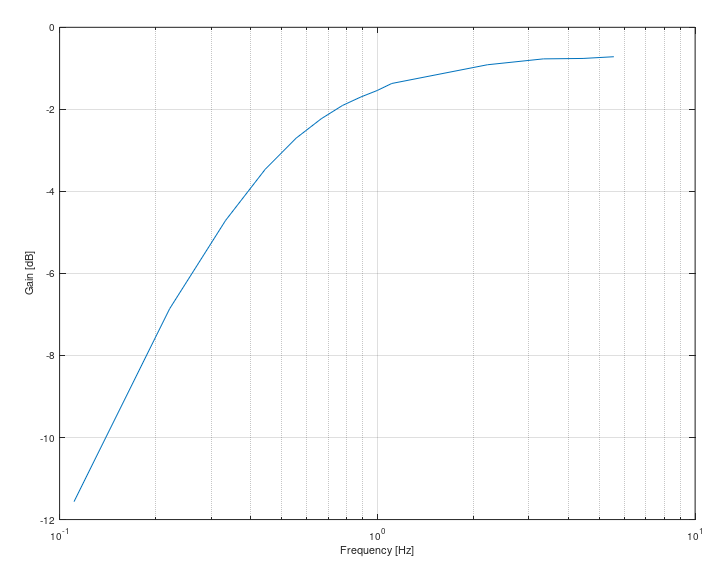
Figure 19:
low frequency gain
The result is incredible: the frequency
corner is at 0.5Hz! We can use this information to
evaluate the inductance of the transformer at this
frequency:To be honest, the signal at this frequency is strongly distorted. These are the signals at 1Hz and 0.5Hz
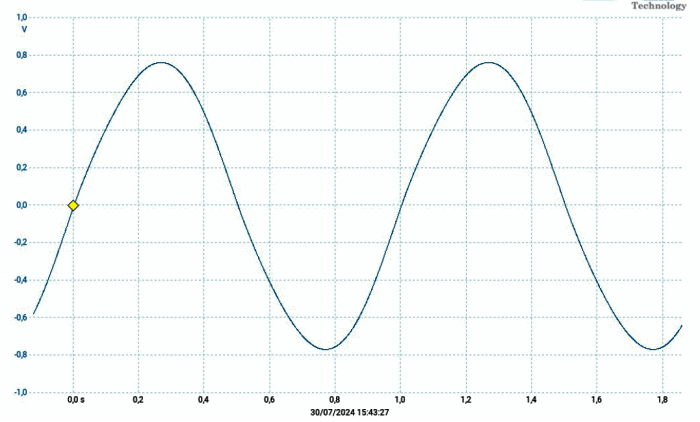
Figure 20: 1Hz signal, 2Vpp input
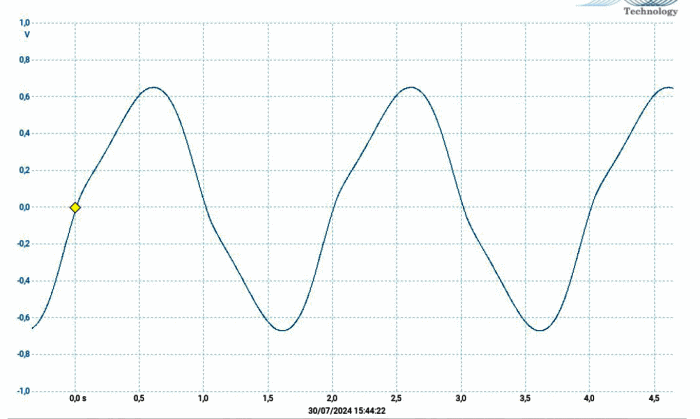
Figure 21:0.5Hz signal, 2Vpp input

Figure 21:0.5Hz signal, 2Vpp input
The 1Hz has just a bit of visible distortion: the transformer can be used up to this frequency without problems. Keeping in mind that there is non-negligible distortion it is possible to use it also down to 0.5Hz. As usual, you must keep in mind the limitations and use it accordingly. I can’t measure the distortion at these low frequencies, but it could be interesting to analyze the distortion between 20 and 20kHz.
The differences compared to the entry level transformer are evident. Quality pays.
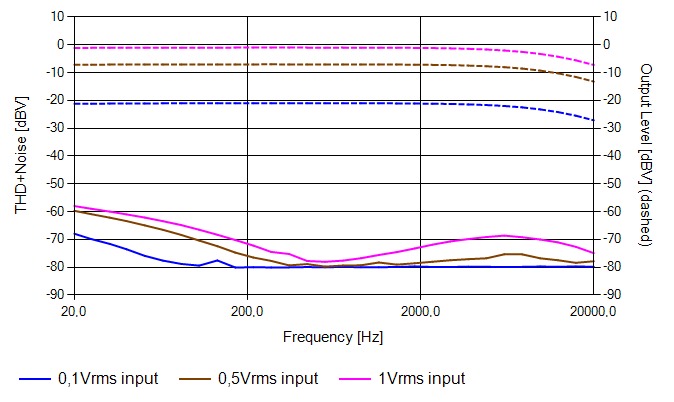
Figure 22:
distortion of the circuit
In the economical transformer, intermodulation distortion had negatively affected the device's performance. Will this problem be overcome with the professional transformer? Let's repeat the same tests done on the economical transformer in the following figures. The improvement is significant; the SFDR is now 70dBc. Sure, there are still some artifacts present, but far fewer. In Figure 23, the background noise is still visible!
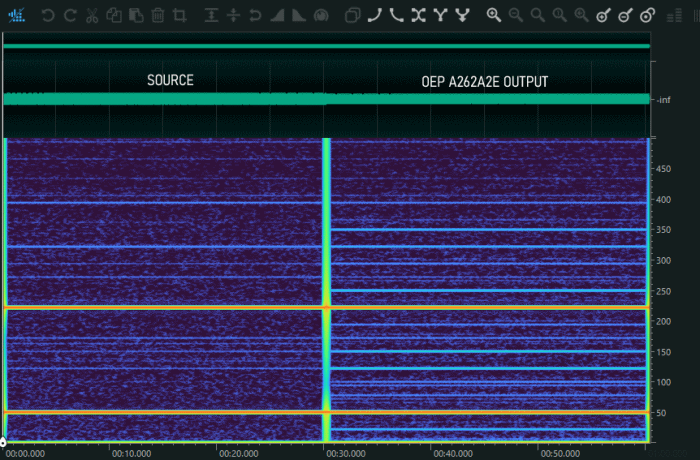
Figure
24: Two tone signal directly feed into audio soundcard
(left side) or through the professional transformer
(right side)
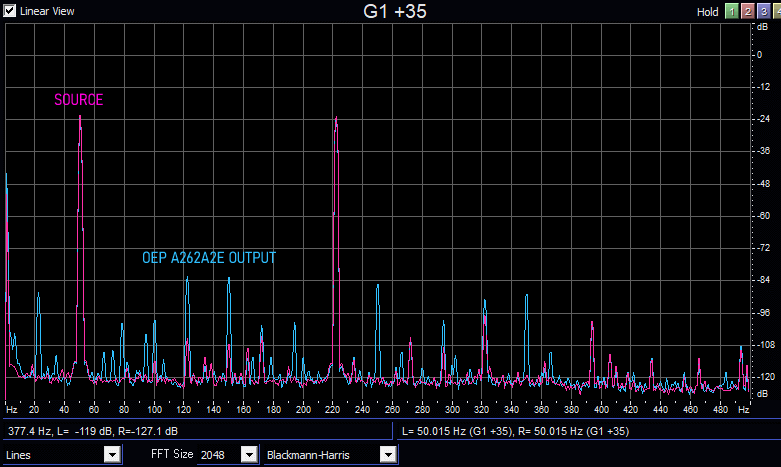
Figure 25:
Two tone signal directly feed into audio soundcard
(magenta trace) or through the cheap transformer
(magenta trace)
A complete circuit
We will now suggest a complete application circuit. This device isolates the signal, by means the transformer, and the power, using a Traco DC-DC converter. The isolation divides the circuit into two parts: the “Sensor Side” and the “Lab Side”. The first contains the signal input and the power supply output. The second the signal output and the power supply input.
The power supply of the operational amplifier can be any voltage between 9V and 30V. if you want to change the DC-DC converter, care must be taken to give it the right voltage according its own specifications.
Finally you can find a picture of the circuit built by Renato Romero and tested in its monitoring station.
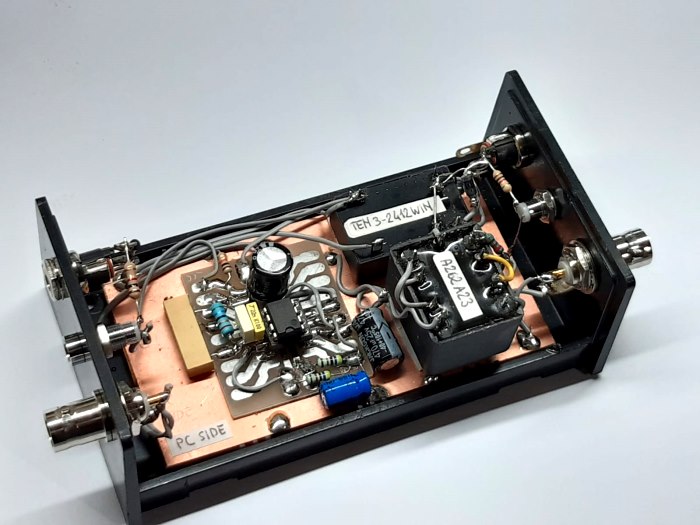
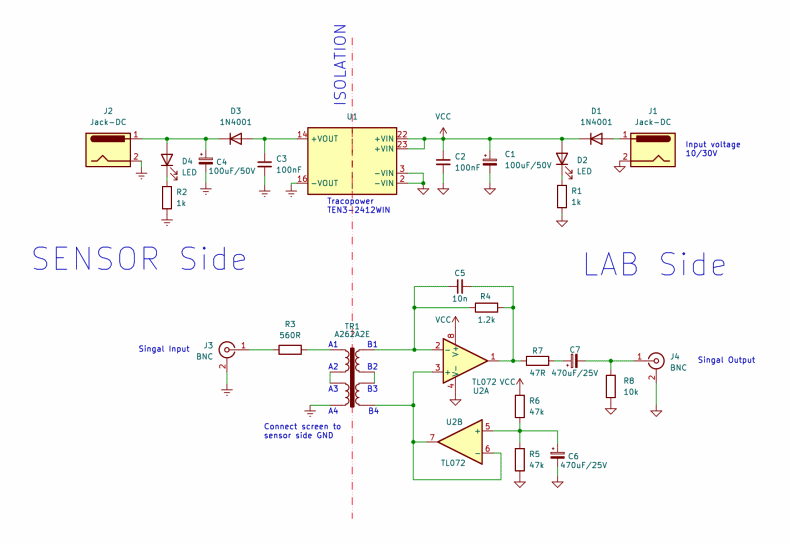
Fig. 27 the final electric scheme
Conclusion
First, congratulations on getting this far: not everyone does, so thank you! We have qualitatively described some limitations of the transformer as an isolator using a cheap and commercial device. Then, we analysed a practical circuit and derived the equations to size it with any available transformer. We analysed the performance obtained, which is truly enviable, using a high-quality transformer. I hope this journey into the world of transformers has been enjoyable and I hope that the suggested little circuit can be a valuable aid for your setups.
Return to www.vlf.it main index