|
|
OPERA
2015 Osservatorio Permanente Emissioni Radiosismiche (Radio-seismic Emission Permanent Observatory) By Renato Romero PART I - Premises and start of the monitoring, until the 2015 end |
In this research project we will look at a particular type of hypothetical seismic precursors: radio emissions at very low frequencies. According to many publications, some of which also appeared in authoritative scientific bulletins, these signals would be present for all earthquakes of magnitude greater than 6, at low frequencies, with intensity strong enough to allow worldwide detection. Low frequency radio precursor signals would begin several hours before the event, and given their intensity they would be receivable on the whole planet: they would cease immediately after the earthquake. Many of these studies are based upon data acquired with non-commercial, bespoke systems, having technical specifications comparable to those of more expensive professional equipment such as induction coils or flux gates; others are based on professional systems. The question arises: if these signals are strong and they are always present at every high-intensity earthquake, why are they currently not used to make predictions? The OPERA project, with a one year listening campaign, will attempt to answer this question.
INTRODUCTION
There usually is a seismic event of some significance to direct the attention of the media about ability to predict earthquakes, leaving transpire that, thanks to the work of researchers, it will soon be possible to have the forecasts as today we already have the weather. At every opportunity it seems that the aim of the forecast is now at your fingertips. But the ones who have few years on the shoulders will not be in trouble to remember a certain recurrence of the news. Back to the mind by analogy the future proposed in the late '60s, in the wake of the enthusiasm immediately after the conquest of the Moon: in the early '70s was English TV series such "SPACE 1999" to hypothesize within 30 years the exploitation of the moon as a nuclear waste repository , with a human colony on a permanent basis on the satellite.
 |
 |
 |
| SPACE
1999 logo |
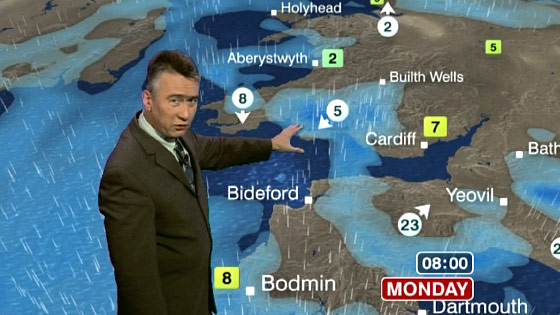
Weather
forecast |
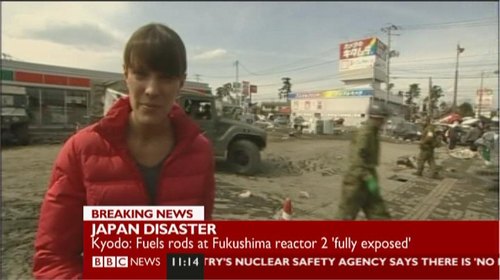
BBC
earthquake reports |
Sooner we should get down on Mars, then the solar system and to follow, the colonization of the entire universe. Today, however, after almost half a century, except for six signs of life on the International Space Station, we still are here, on Earth. When it comes to earthquake prediction are therefore faced with another illusion as the space conquest? With this comment we do not want to immediately exclude the opportunity to predict earthquakes. But we also must objectively observe that this topic lends itself to a lot of speculations. Opera will try to base its conclusions solely based on records, acquired from monitoring stations, integrated in some cases from data coming by geophysical observatories in northern Europe.
WHAT'S OPERA AND WHY
The OPERA project is a planned activity, which consists on one year VLF systematic monitoring (2015), with a writing from time to time a technical report of any episode that exceeds a certain threshold scale, calculated by comparing the earthquake intensity and the distance from it for each single monitoring unit. OPERA 2015 stands for Osservatorio Permanente Emissioni Radiosismiche (Permanent Observatory of Radioseismic Emissions). The first OPERA Project, was in 1997 and it was addressed to the frequency of occurrence, the hours more propitious, and the seasons in which it was possible to listen radio nature signals, like Whistlers. The results were published on INSPIRE Journal, but the project was realized with absolutely primitive resources, including a cassette recorder, a boiler timer, the RS-4 INSPIRE electric field receiver and an aerial loop to detect magnetic field. Despite the extreme craftsmanship of devices, and the measurements in a single site only, the obtained results at that time are still comparable to those we obtain without difficulty by our network nowadays.
therefore now we have a lot more: OPERA 2015 is an ambitious project aimed at producing an official document certifying the results of our research, using data gathered during a campaign Listens for one year, using the existing monitoring network.
 |
|
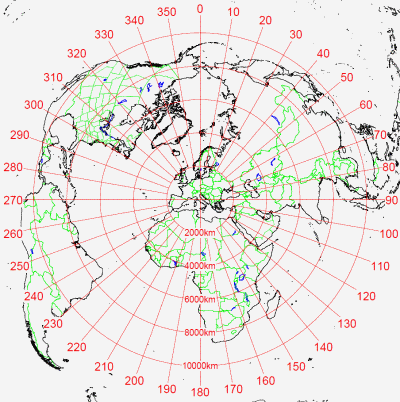
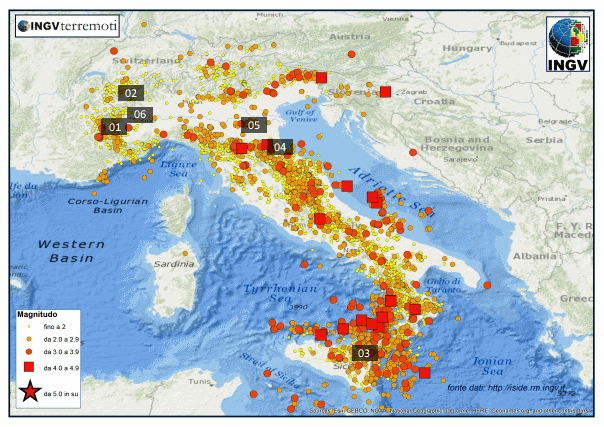
It will include the monitoring of all seismic events on a global scale with a magnitude greater than 7.5, and, gradually to decline, down to the earthquakes of magnitude 4 occurred in proximity of at least one of the five stations, plus all the geomagnetic pulsations occurred, relating to solar storms. At the end of the campaign a detailed analysis of the signals collected from workstations (a report for each event with the signals collected from the participating stations) will form a rich documentation about the extremely low electromagnetic frequencies and its relevance or not to seismic events, including volcanic phenomena given that a station is right on the slopes of Etna volcano. With this project we don't want invalidate anyone: taking advantage of the high seismicity of the Italian peninsula we only wish to make an organic search based on a considerable number of observations, performed by monitoring stations spread on our national territory. |
In the above chart the world seen from Italy in an azimuthal chart (map edited with Azimuth Map V 3.2 by Tony Field VE6YP). The OPERA project will refrain as much as possible from any kind of conjecture: final conclusions will only be the result of these measures.
OPENLAB VLF MONITORING STATIONS AND PROJECT PARTICIPANTS
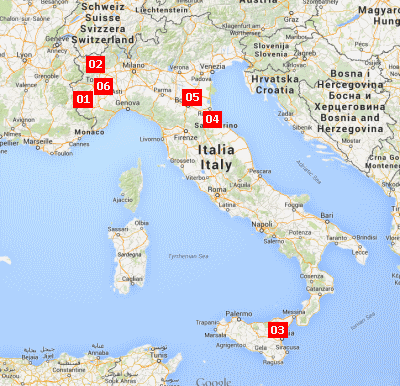
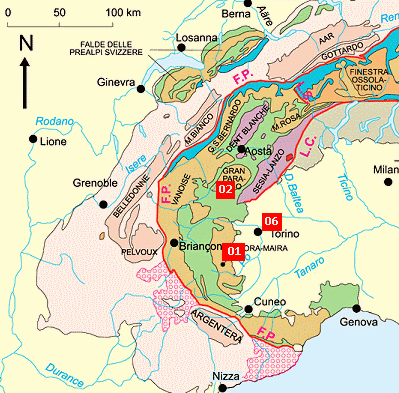
The VLF Openlab Observatory is an Italian network of VLF monitoring stations. They share the spectrogram settings, like brightness, contrast, scroll time, FFT resolution... so that results can be easily compared: it is very easy this way to understand if the same signal has been received from one or more stations simultaneously. This structure consists of six stations and begins from the free collaborations within the activities of OpenLab www.vlf.it, the portal since 1999 dedicated to the techniques of receiving and to the study of natural radio signals of very low frequency. In addition to publishing articles vlf.it has always had attention to VLF monitoring: permanent recordings begin in 2002 from the station of Cumiana (01 in the chart above), but the network as we know it today, begins in 2007 with the activation of the station at Pontese dew (02), in Gran Paradiso Park, activated with the support of the CSP (Regione Piemonte Research Center). The main objective of the network was, since from the beginning, the monitoring of signals at very low frequency, with a focus on the presence of possible radio seismic precursors.
 |
|
 |
| Italy
map with OpenLab monitoring stations siting |
Detail of
station 1-2-6: red lines indicate tectonic
lines (full
chart here) |
Along the way they added two locations on the slopes of Etna volcano in Sicily and allocated inside the National Park structure (03) an other one in Emilia Romagna Region (04), a station on the National Institute of Radio Astronomy of Bologna (05) in autumn 2012, and last the monitoring station in the city of Turin (06), on the hills near the city .
The VLF OPENLAB OBSERVATORY monitoring structure is today composed by:
 |
01 -
IK1QFK CUMIANA (TO), NW Italy (Azimuth
chart) Maintained by Renato Romero (Network coordinator) and Luca Feletti Equipped with: two induction coil, big Marconi antenna, geophone, ogg vorbis streaming, GPS Direct link: http://www.vlf.it/cumiana/livedata.html |
|
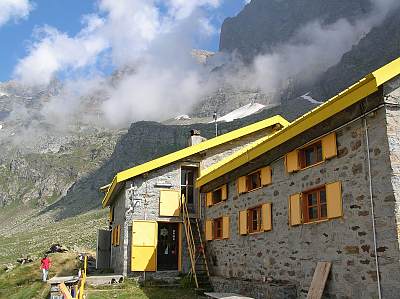 |
02 - CSP
VLF MONITORING STATION From Pontese dew (TO), NW
Italy (Az.
chart) Maintained by CSP Team: Roberto Borri, Luca Seoli and Claudio Re Equipped with: multiturns aeral loop and differential electric field receiver (ADA) Direct link: http://ham.radio.it/vlf/pontese/pnts_observatory.htm |
|
 |
03 - ETNA
RADIO OBSERVATORY From NICOLOSI (CT), Etna Park,
Sicily, S Italy (Az.
chart) Maintained by Rosario Catania - Alessandro Longo - Salvo Caffo Equipped with: Induction coil, orthogonal VLF loop, geophone. Direct link: http://www.vlf.it/etna/etna_live.html |
|
 |
04 -
ROMAGNA OBSERV. From
Fiumicino(FC) / Sogliano al
Rubicone(FC), N Italy. (Az.
chart) Maintained by Federico Scremin Equipped with: Induction Coil, marconi T antenna Direct link: http://www.webalice.it/rromero/live_sogliano/Romagna_Live_ELF_ULF.html |
|
 |
05 -
NORTHERN CROSS RADIOTELESCOPE From Medicina (IT
- Bologna), N Italy (Az.
chart) Maintained by Jader Monari, Massimo Silvestri, and Renzo Cabassi Equipped with: induction coil, static electric field receiver. Direct link: http://www.ciph-soso.net/vlf_it/medicina_live.html |
|
 |
06 -
TORINO VLF MONITORING STATION, NW Italy
(Az.
chart) maintained By Claudio Re and Fabrizio Francione Equipped with: Marconi Antenna, differential electric field receiver (ADA), fluxgate Direct link: http://www.vlf.it/torino/torino_live.html |
The stations are followed by operators locally and centrally coordinated through TeamViewer.
WHAT WE ARE GOING TO MONITOR
During the year of activity, OPERA will monitor seismic events that exceed an attention threshold: they will be chosen with a scalar criterion later explained. Even low frequency earth's geomagnetic activity will be monitored: in the OPERA tabs will also be included the receptions of geomagnetic pulsations, effect of solar flares and solar wind investing our planet.
Here is the summary of signal categories and workstation involved from time to time:
|
- SRS (spectral resonances structures) - PC1 (type 1 geomagnetic pulsations) - VERY HIGH INTENSITY EARTHQUAKE - MEDIUM INTENSITY EARTHQUAKE - LOW INTENSITY EARTHQUAKE - PAROXYSM (lava flows) - NOT CLASSIFIED ANOMALIES |
-->
when received from two or more stations --> when received by one or more stations + Kiruna --> all the stations --> station that exceed a scalar criterion (documented below) --> only if the monitoring station is positioned just above the earthquake --> Etna volcano monitoring station only --> all the monitoring station |
The events database will be available on-line to the voice "MONITORED EVENTS" below and updated as that they occur.
As earthquake data source will be used the following official websites:
- http://cnt.rm.ingv.it/ - Istituto Nazionale di Geofisica e Vulcanologia
- http://iside.rm.ingv.it/iside/standard/index.jsp - Istituto Nazionale di Geofisica e Vulcanologia
- http://www.ct.ingv.it/ufs/analisti/maps.php - Istituto Nazionale di Geofisica e Vulcanologia
- http://earthquake.usgs.gov/earthquakes/ - U.S. Geological Survey
Also for reference of the geomagnetic activity we prefer to use data from institutional observers:
- http://www.irf.se/maggraphs/puls.php - Kiruna Geophysical Institute (Sweden )
- http://www.sgo.fi/Data/Pulsation/latestPulsation.php - Sodankyla Geophysical Observatory (Finland)
Their data are referenced, its equipment is maintained by professionals, and the data reported have metrological value. They are known worldwide for the quality of their reception. Moreover, the presence of a strong signal worldwide coverage, if seen from amateur stations, less sensitive, and positioned in places with high electromagnetic pollution (as in an home apartment), will can not escape to an high sensitivity observatory placed in areas carefully chosen among the most quiet ones of the planet.
DEFINITION OF RADIO-SEISMIC INDICATOR (RI)
We started from an initial hypothesis: if radio seismic precursors exist they will be easier to be received if we are near the earthquake and if the earthquake is of high intensity. This statement may seem trivial but allows us to establish a choice criterion. If we attribute to a given magnitude an arbitrary amount of RF energy, calculating the attenuation of an electromagnetic signal, we get a gradient that indicates the possibility of receiving a precursor, determined by the combination of distance and amount of generated RF energy.
Since the possibility of propagation of a signal in the soil increases with the wavelength, it is most likely that if in depth are generated radio waves, only those with lowest frequency will be able to arrive up to the surface. And low frequencies mean long wavelength and long Fresnel distance: in most cases our monitoring station will be in reactive area. The attenuation computing must consider the isotropic attenuation from free space (that in levels means 1 / 1, linear), the magnetic filed attenuation in reactive area according to Biot Savart Law (in level goes as 1 / r 3), and electric field attenuation in reactive area (in level as 1 / r2). Also according to the known data available on the propagation of these signals we have achieved a table that summarizes with good approximation the sum of these three behaviours: it is calculated considering that the distance covered increases with the cube of the power generated, assuming that our centre band is 10 Hz.
Starting from Wikipedia Richter scale reference (http://it.wikipedia.org/wiki/Scala_Richter) we calculated:
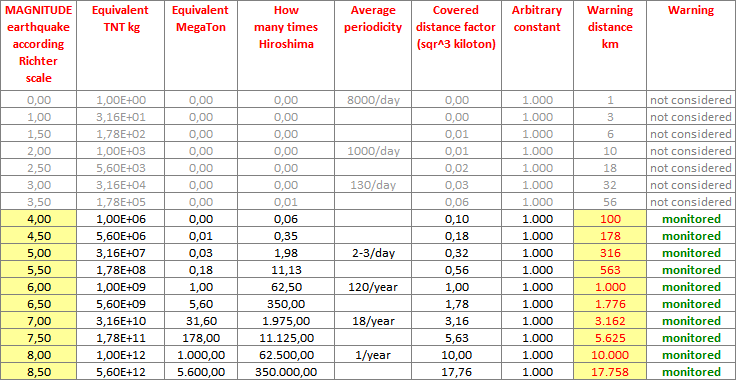
This assessment is arbitrary, because it does not consider some factors, we know: not necessarily all earthquakes can be source of RF signals, not all earthquakes occur at the same depth, not all soils are equal... but it allows us to establish a choice criterion, to avoid to monitor thousands of seismic events, but choose only those, where the probability to detect hypothetical precursors is higher. Anyway for events that are not highlighted here, we can still, if necessary, recover all recordings (spectrograms and source wave files) from our database, also in a second time. But here's how we got to calculate the selection table above.
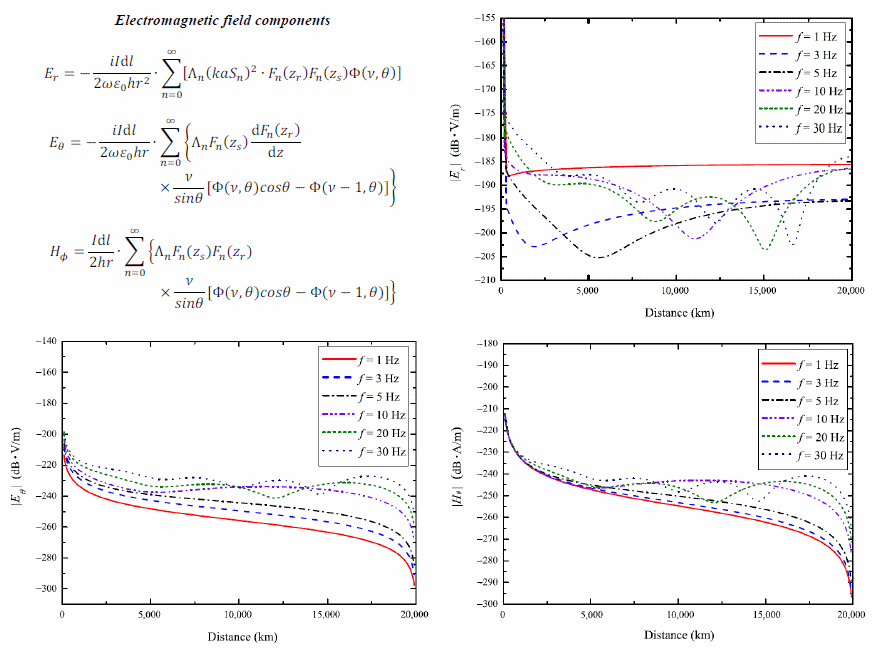
Since the '50s, many mathematical models for the study of the propagation of electromagnetic waves in cavity have been developed from the ELF (<30 Hz) up to VLF (3-30 kHz) range. In these models, the wave guide consists of two concentric spherical surfaces, with a reflection coefficient almost unitary, one of which is representative of the Earth's surface and the other of the lower limit of the ionosphere. Within this guide, the field sources are modelled by vertical electric dipole (VED), vertical magnetic dipole (VMD) and by horizontal electric dipole (HED). In order to support mathematically the method of Radio-seismic Indicator (RI), previously introduced, we can consider the presence of a VED source within a wave guide such as that described. The effective wave guide height is about 60-90 km. In the range of SLF / EFL, this height is less than the free-space wavelength of considered electromagnetic phenomena; so only a zero-order mode can propagate.
With respect to the following figure:
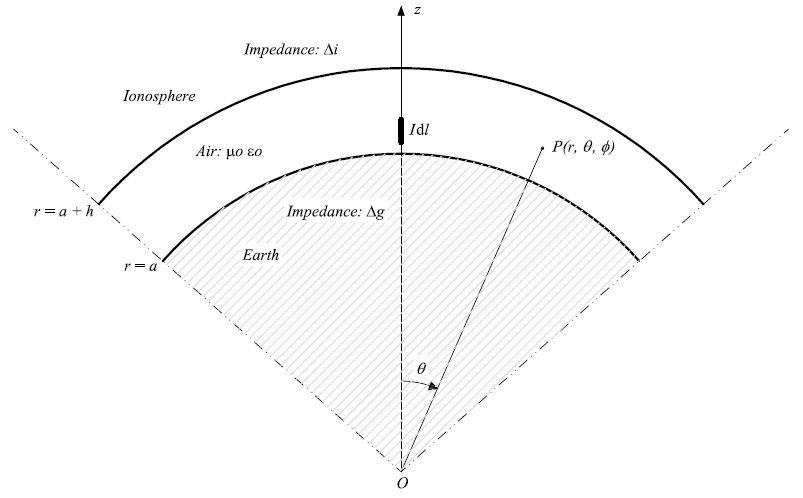
with a VED source, the electric and magnetic fields (for TM waves) can be expressed through the Maxwell's equations, using a potential. Taking into account the particular geometry of the problem and the type of active sources, it can be demonstrated that the components of these fields are so expressible:
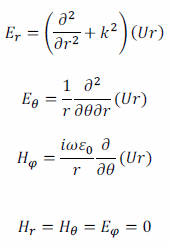
being:
The potential U, through which the field components are expressed, satisfies the Helmholtz equation:
Using appropriate boundary conditions, derived from the expression of normalized surface impedances that define the wave guide, the Helmholtz equation can be solved, obtaining the expression of the potential U as a function of r and θ.
Through mathematical manipulations here omitted, but entirely explained in [1], this expression can be used to obtain, a very complex complete formulas for the electromagnetic field of a VED in the Earth-ionosphere wave guide. In SLF, the above expressions can be suitably approximated (as stated in [1]) and transformed into a easier to use form. In ELF, in which we are interested in, it is not possible to use the above simplification as the wavelength, in this case, is comparable with the Earth's circumference. Then, some algorithms were developed (some of them are described in [1]) in order to overcome the above mathematical difficulties and obtain usable formulas.
Assuming:
Earth's radius: 6.370 km
current moment of the dipole: 1 A m
ground conductivity: 10^-4 S/m
ionosphere conductivity: 10^-5 S/m
ionospheric equivalent reflection height: 70 km
using the above algorithms, the magnitude of the electromagnetic field components can be obtained and showed in the following figure for f = 1 Hz, 3 Hz, 5 Hz, 10 Hz, 20 Hz and 30 Hz.
The method of Radio-seismic Indicator (RI), introduced to discriminate those earthquakes potentially interesting with respect to the electromagnetic activity, among their totality, is a tool, easy to use, whose validity is limited to the above purpose, but which, in any case, does not counteract the rigorous mathematical theory.
In fact, we can evaluate, for example, the magnetic field magnitude as a function of distance with the RI method and compare the result with those obtained with the algorithm described in [1].
The result of the comparison is shown in the following figure and we can note a good behaviour of RI method.
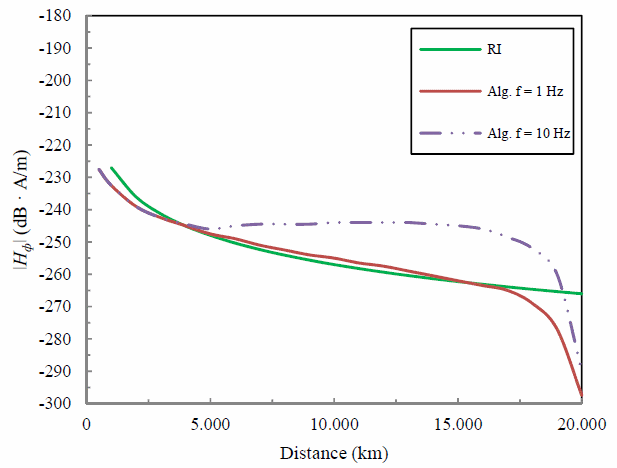
For further details, we suggest the consultation of the listed references.
A text in electro magnetics is also useful to find the theory about the Maxwell's equations and their solution in particular cases with respect to the sources and geometry of the problem. Although relative to a particular scope and devoted to frequencies higher than those considered here, we want remember the study conducted by Bannister and Fraser-Smith [3], whose results constitute a reference element for the argument of our interest.
In [1] is also shown a comparison between the results obtained with the algorithms developed for the solution of the field equations and those obtained by Bannister.
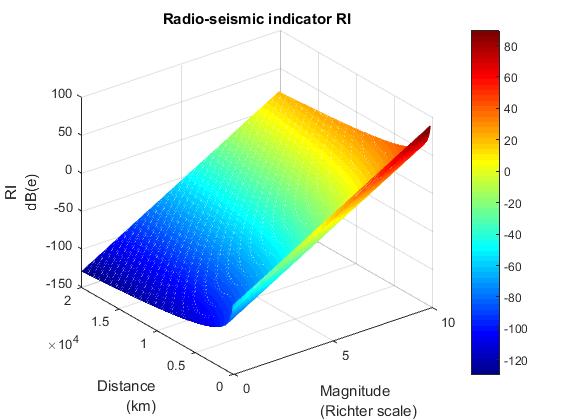
An observer can evaluate the Radioseismic Indicator (RI) using the following formula:
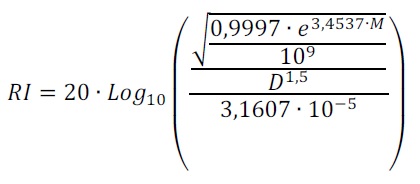
Here below a graphic representation of Radio-seismic indicator, with a simply on line calculator:
 |
Radio-seismic calculator (works with Firefox) Insert
magnitude:
Insert distance (Km): |
RI_simply.xls
The complete Excel sheet we use to evaluate seismic list compatibility from http://cnt.rm.ingv.it/ is here:
distance_RI_rev_5.xls
References
[1] Weiyan Pan, Kai Li "Propagation of SLF/ELF Electromagnetic Waves"; Springer, 2014
[2] Peng HY, Tao W, Pan WY, Guo LX "Numerical integral method for ELF fields excited by vertical electric dipole in asymmetric Earth-ionosphere cavity"; Chin J Radio Sci, 2012
[3] Bannister PR, Fraser-Smith AC "Reception of ELF signals at antipodal distances"
[4] Bannister PR "ELF propagation update"; IEEE, 1984
[5] Bannister PR, Wolkoff EA, Katan JR, Williams FJ "Far-field, extremely-low-frequency propagation measurement"; Radio Sci
[6] Watt A. D. "VLF Radio Engineering"; Pergamon Press, 1967
This part has been developed by Luca Feletti and Renato Romero
ANDROID APP FOR SMARTHPHONE
The activities of the research project can also be followed with mobile devices using our Opera2015 APP.
The APP can be downloaded from the following links:
 QR CODE |
|
Made by Rosario Catania, Etna Radio Observatory.
(This app has been active throughout the year 2015. It has helped us to check the health status of the stations whenever we wanted it, from everywhere)
SOME TECHNICAL REFERENCES
In these articles there are descriptions of how the monitoring stations are to be realized and how they're built some of their sensors:
- How to start up a VLF observatory
- How to put a VLF observatory on-line
- Create your own streaming VLF Audio program
- INDUCTION COIL ICS101
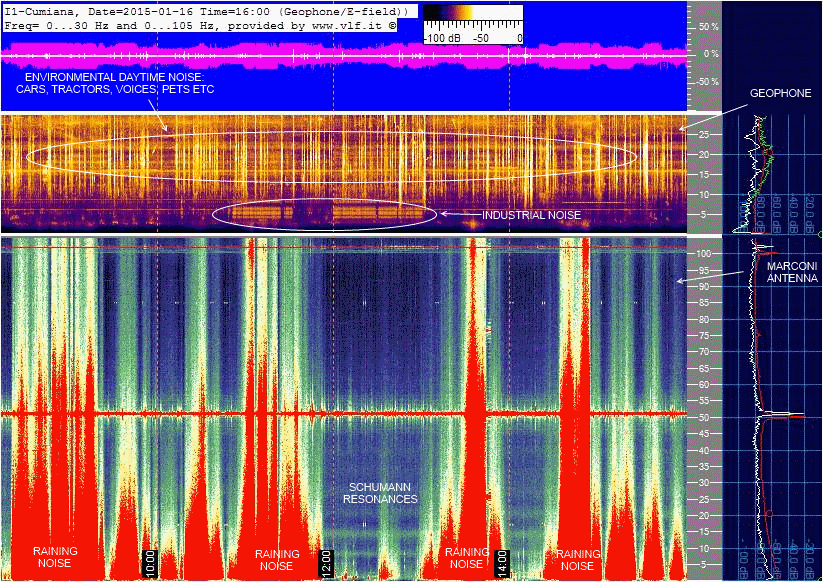
Here just some preliminary notes at the beginning of the monitoring. We use FFT analysis because it is the best way to graphically display the natural background noise, made by Schumann Resonances from 5 to 50 Hz, and Geomagnetic Pulsations over a hiss background below 5 Hz. But what are we really looking for? We are seeking anomalies extraneous to the noise background: burst, glitch, hiss, whistle, tone... or anomalous background noise level variations. According to the spirit of Openlab, which governed all work so fare published on the site www.vlf.it, also the results of this research campaign will be shared with everyone. In addition to the spectrograms for each event we will also be publishing wave files sources: in this way you will be able to reprocess the original signal, directly from your home.
At the beginning of the monitoring activities we wondered if it was necessary to calibrate receiving systems, because all workstations are using sound card and we know that sound cards have not a precise reference frequency. We did test it but, due to high thermal excursion, stations although calibrated didn't keep the alignment for a very long time. After various tests we have therefore decided to not calibrate monitoring station frequency reference. We have preferred to prioritize "the time reference" of each location. Any workstation runs a time client software, periodically connected to a time server. Hours reported on workstation files are therefore accurate within +/- 20 ms. For any audio file, available for analysis, we are sure of the starting time accuracy: if you require a precise time reference for the entire recording, open an audio editor, and normalize the file length to 4 or 8 hours exactly (14400 seconds or 28800) . This way the times will correspond with an accuracy of +/- 20ms through the entire recording.
Signals so far received by our network (first monitoring station is active since 2002), lead us to suppose it will be impossible to arrive to earthquake forecasting. We will be nevertheless very happy if one day we shall say: "we were wrong!"
|
|
OPERA
2015 Osservatorio Permanente Emissioni Radiosismiche (Radio-seismic Emission Permanent Observatory) By Renato Romero PART II - Data analysis and considerations, performed on the data collected in the measurement campaign of 2015 |
2015 SEISMIC ACTIVITY
The events selection treated in OPERA project was made on data provided by INGV, the Italian Institute of Geophysics and Volcanology. The National Seismic Network (RSN) has traced and reported the data of 15'532 earthquakes, occurred between January 1 and December 31, in Italy and world in 2015. In the same year, in Italy and in geographically nearby areas, occurred on average just over 40 earthquakes in a day, this means an earthquake almost every half hour.
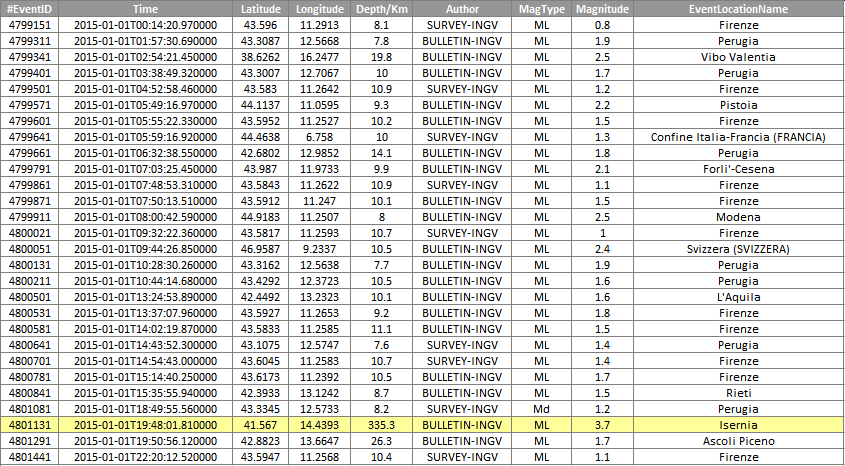
Table activity of 1st January 2015 with 28 events. Of all these, only one, in yellow highlighted, exceeds the magnitude threshold of 3.2.
Compared to previous years the number of localized earthquakes is significantly decreased: in fact, both in 2013 as in 2014, there were more than twenty thousand events recorded only in Italy, mainly due to some seismic sequences, with numerous events, which lasted in the month. Like every year, the vast majority of recorded earthquakes had a magnitude of less than 2.0: more than 13'000 events.
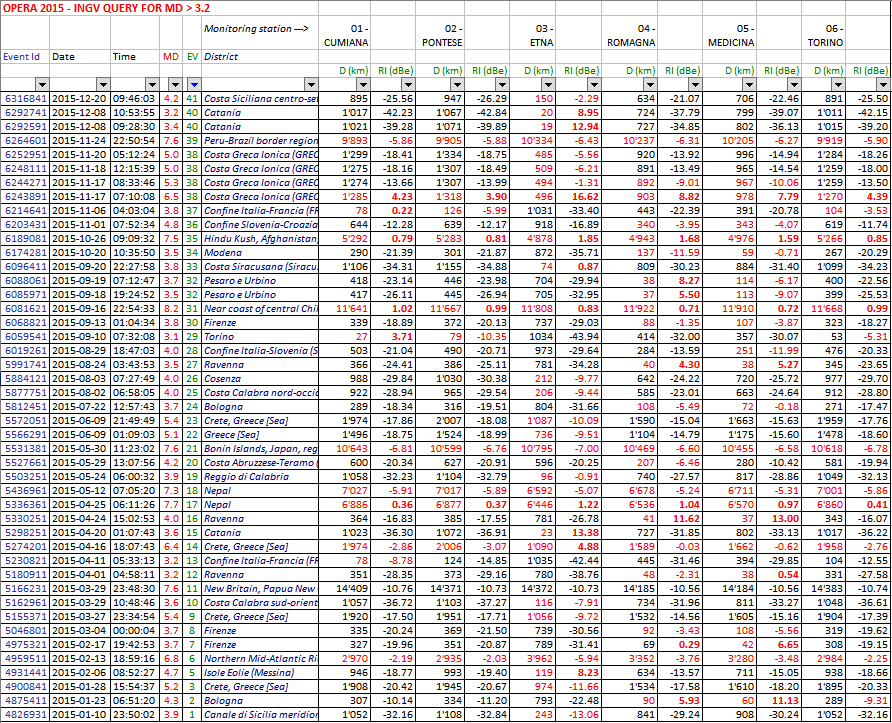
Of 15532 episodes documented by INGV, only those with magnitude greater than 3.2 were selected for our study, which have been around 279. On these 279 was applied the RadioSeismic Index Calculation described above, selecting 46 events to be analyzed, those with the highest probability of finding associated radio emission
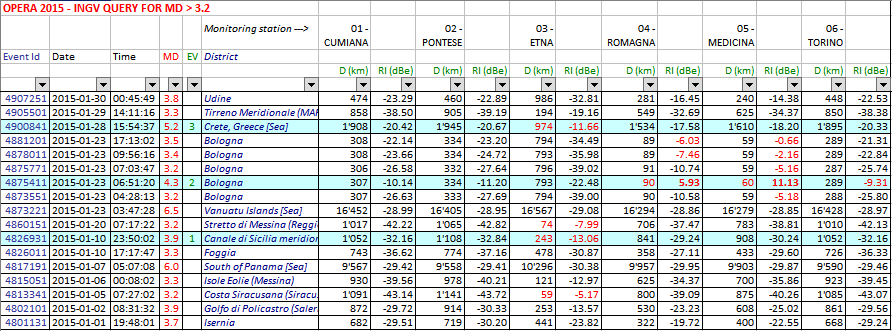
January 2015 table activity for magnitude more than 3.2: light blue highlighted the events with high RI index.
The selection threshold was placed with an index of -10 dBe RI, with a few positive exceptions where the earthquake had been detected in a very intense way by the station geophones, or perceived directly by the people. And with some negative exception in cases where the stations interested were out of service for maintenance. This led to an analysis which covered 41 events, with a greater possibility of existence of associated radio signals, most single and someone multiple, including also some paroxysms.
Total 41 selected events table.
GEOMAGNETIC PULSATION DATA ANALYSIS
During the year of uninterrupted EM monitoring in very low frequency range, our systems have received a lot of natural radio signals extraneous to the ordinary background noise. They are triggered by events occurring outside our planet, such as solar flares, and nothing they have to do with earthquakes: we are talking about PC1. To analyze these signals, the FFT process is confirmed as the most suitable analysis method, because it’s the best way to see natural noise background composition: it's no coincidence that the FFT processing is the most used in the geomagnetic pulsations representation.
The geomagnetic signals analysis may be, at first sight, an "off topic", but it is not, and is not a trivial statement: the basic requirement to identify an anomaly is to be able to recognize exactly what are the elements that an ordinary situation is made of. It would be difficult to hunt down an anomaly, and lead it back to a radio seismic origin, if we are not even able to receive regularly the natural background and to recognize the signals commonly found that for sure are not of seismic origin, like the geomagnetic pulsations. This is the reason because Opera has included in its analysis also receptions of geomagnetic pulsations of the year covered by the study, comparing them with the reception made by institutional observers such as Kiruna Geophysical Institute (Sweden ) http://www.irf.se/maggraphs/puls.php and Sodankyla Geophysical Observatory (Finland) http://www.sgo.fi/Data/Pulsation/latestPulsation.php
- Pulse 021 Gravitational Wave detecetd by
LIGO on 2015 September 14
09:50:45 UTC
- Pulse 020
PC1 - Geomagnetic pulsations sequence 2015 from
December 20 to 24
- Pulse 019 PC1 - Geomagnetic pulsations sequence 2015 from October 11 to 13
- Pulse 018 PC1 - Geomagnetic pulsation 2015 September 16, from 01:00 to 03:00
- Pulse 017 PC1 - Geomagnetic pulsation from 2015 Sept 10 23:00 to 2015 Sept 11 05:00
- Pulse 016 PC1 - Geomagnetic pulsation from August 29 20:00 to August 30 06:00
- Pulse 015
PC1 - Geomagnetic pulsation 2015 August 29 18:00
- Pulse 014 PC1 - Geomagnetic pulsation in the night between 19 and 20 August 2015
- Pulse 013
SRS - Spectral Resonance Structures in the night
between 11 and 12 August 2015
- Pulse 012 PC1 - Many Geomagnetic pulsations 2015-06-23/24/25/26 and 27
- Pulse 011 PC1 - Geomagnetic pulsations 2015-05-16/17 overnight
- Pulse 010
PC1 - Geomagnetic pulsation 2015-03-24 06:00 to 08:00
- Pulse 009 PC1 - Geomagnetic pulsation 2015-03-21 17:00 to 23:00
- Pulse 008 PC1 - Geomagnetic pulsation 2015-03-20 22:45 to 23:45
- Pulse 007
PC1/SRS with geomagnetic storm, 2015-03-18 to
2015-03-20
- Pulse 006 PC1 - Geomagnetic pulsation 2015-03-05 02:00 to 03:00
- Pulse 005 PC1 - Geomagnetic pulsation 2015-02-27 01:00 to 09:00
- Pulse 004 SRS - Spectral Resonance Structures 2015-01-19 00:00 to 08:00 and following days
- Pulse 003 PC1 - Geomagnetic pulsation 2015-01-10 03:00 to 07:00
- Pulse 002 PC1 - Geomagnetic pulsation 2015-01-09 01:50 to 08:00
- Pulse 001 PC1 - Geomagnetic pulsation 2015-01-08 03:00 to 06:00
- Pulse 000 PC1 - Geomagnetic pulsation 2015-01-07 06:00 to 08:00
Therefore, as we can see, the sun in 2015 gave us an intense geomagnetic activity, with several magnetic storms that led to the origination of many "type 1" pulsation. By studying the reception of these signals it has been possible to verify and confirm what we already knew. The pulsations at frequencies less than 1 Hz are more typical of polar areas and their intensity decreases moving toward the equator, while those at higher frequencies up to 4 Hz find the best conditions to arise more in the middle latitudes. Also, in mid-latitudes the presence of pulsations it’s almost exclusively nocturnal: most of them will disappear during the day, although at the same time in the polar regions, the phenomenon is still present.
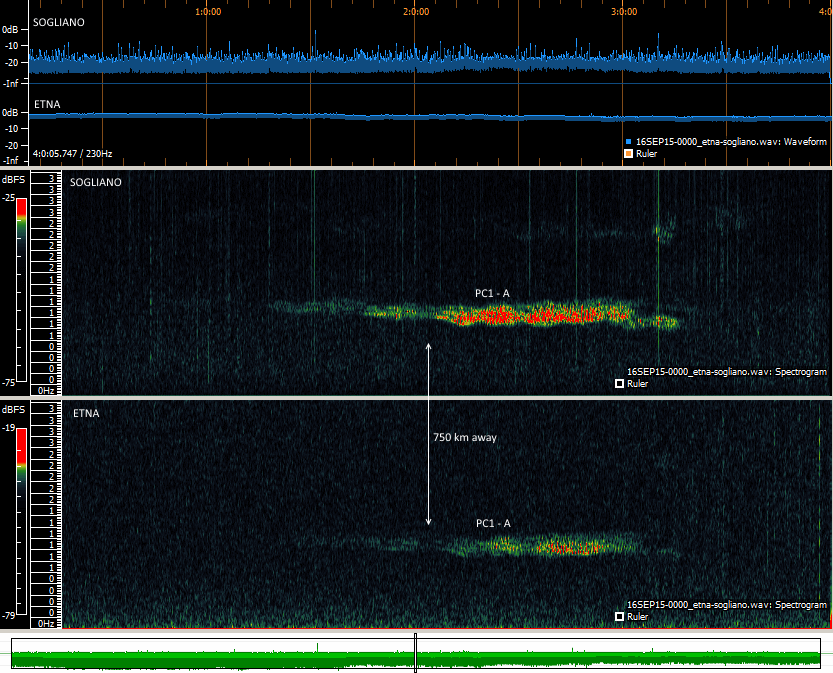
Combining reception between North Italy (Sogliano) and South Italy (Etna volcano) on the same pulsation. Sogliano on Left channel and Etna on right one, accelerated 500 times. 2015 September 16, from midnight to 04:00. Listen this strange stereo effect created by two separated receptions 750 km far away: 12_16SEP15-0000_sogliano-etna.mp3
Some phenomenon were checked until now poorly documented: mid-latitude geomagnetic pulsations are predominantly in east-west component, and not North-South as their polar origin would lead us to think. The same is true for the Schumann resonances: receptions on the orthogonal system EW/NS has always shown a high prevalence of the signal coming from coil positioned with axis in north-south direction than in east-west
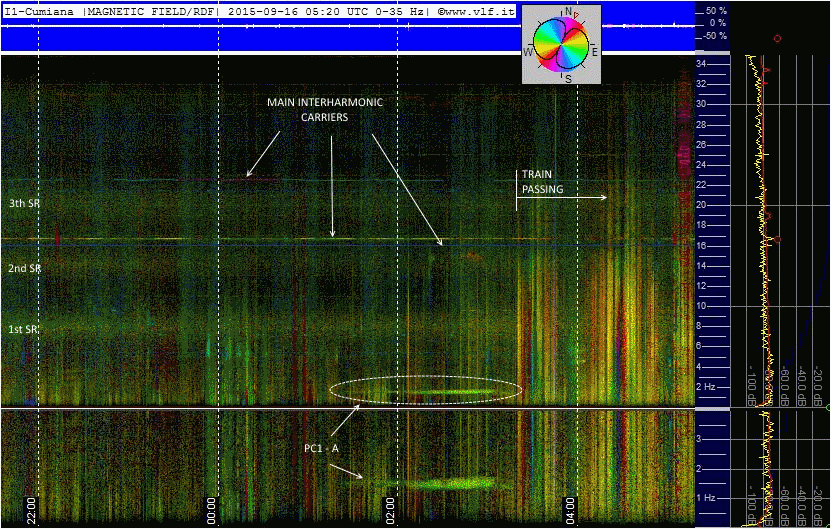
Pulse 018 PC1 - Geomagnetic pulsation 2015 September 16, from 01:00 to 03:00 detected from Cumiana monitoring station with two orthogonal coils. The prevalence of the east-west component with green/yellow color is evident both on the geomagnetic pulsation and on the Schumann resonances.
Even many SRS (the so-called spectral resonance structures) have been detected: discovered by Belyaev et al. (1989, 1990) they are considered to be an evidence for the existence of IAR (ionospheric Alfvén resonator). They are thought to form within the IAR from electromagnetic emissions of lightning charges, just like the Schumann resonances in the ionospheric waveguide, but operating in vertical direction with shear Alfvén waves. Simultaneous receptions between Italian stations did confirm the more local character of this type of emission, if compared to the geomagnetic pulsations, and its closely linked origin in the presence of storm cells, within a few thousands km.
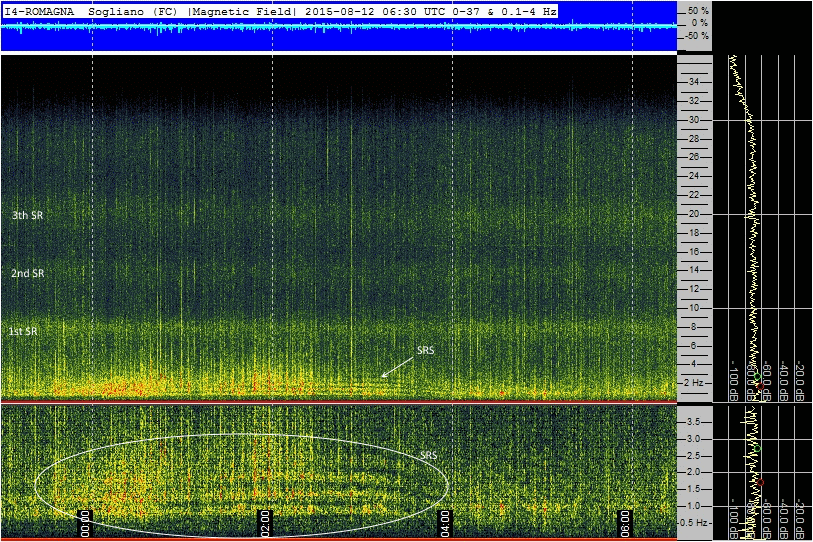
Pulse 013 SRS - Spectral Resonance Structures detected in the night between 11 and 12 August 2015 by Sogliano monitoring station with ICS101 induction coil detector. Strong and clear are also the first three Schuman resonances.
The monitoring of geomagnetic pulsations, in addition to the scientific value in itself, constituted at the same time a continues periodic test on the network stations efficiency: the natural background receiving is a basic prerequisite to certify the validity of the data collected from any location, and this is true for any project that addresses a study about radio seismic precursors of these frequencies.
In the off topic, in addition to pulsation, we also mention the data of our receptions provided at different research organizations for the study of gravitational waves, including the LIGO. In 2015 September 14 09:50:45 UTC it has been announced the first instrumental detection of a gravitational wave. Our data have been requested by LIGO to define the boundary conditions of spectrum, when the gravitational wave was detected. As expected from theoretical predictions no ELF signal was received simultaneously from workstations concurrently with the event. The event with our recording is documented at this address:
pulse_021.html
The OpenLab data were among the few used by LIGO, not coming from university academic structures or research institutions. Beyond the satisfaction of having been able to provide data to an organization such as LIGO, and giving our (very) small contribution to their project, this was also a validation for our measurements campaign, confirming the technical soundness of the systems used in our stations, and the validity of ELF data acquired with it.
INTERFERENCES AND FALSE SIGNALS
Usually we have the natural background we've seen before, constituted by Schumann resonances which is a base, and geomagnetic pulsations during solar storms. There may also be others "ordinary" signals due to anthropogenic activity or simply connected to weather conditions : they are lots and they shouldn't be interpreted as precursors. Others disturbances "on air" arise for example from microphonic effect: our sensors are sensitive to the wind, rain and storms. This is intrinsic in their functioning and can not be avoided, so it is essential to recognize at first glance their signals, their mark on spectrograms.
Hereinafter a small gallery with signals related to anomalies collected from various monitoring stations, and certainly not of seismic origin:
 RAIN/WIND on MARCONI |
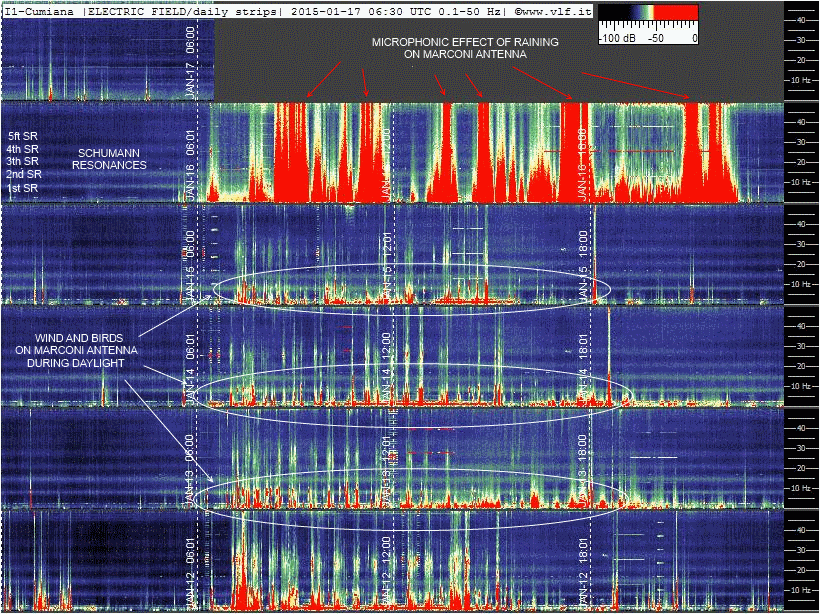 RAIN/WIND on MARCONI |
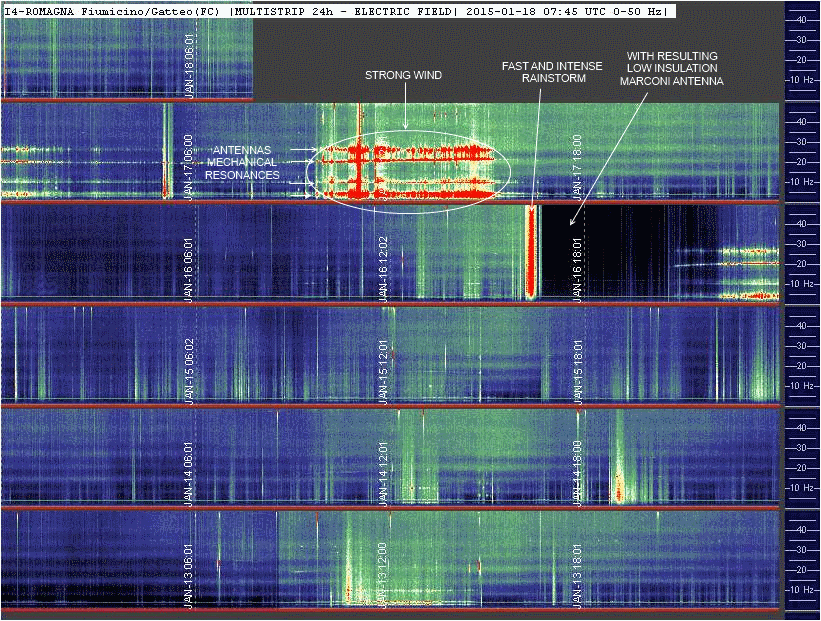 RAIN/WIND on MARCONI |
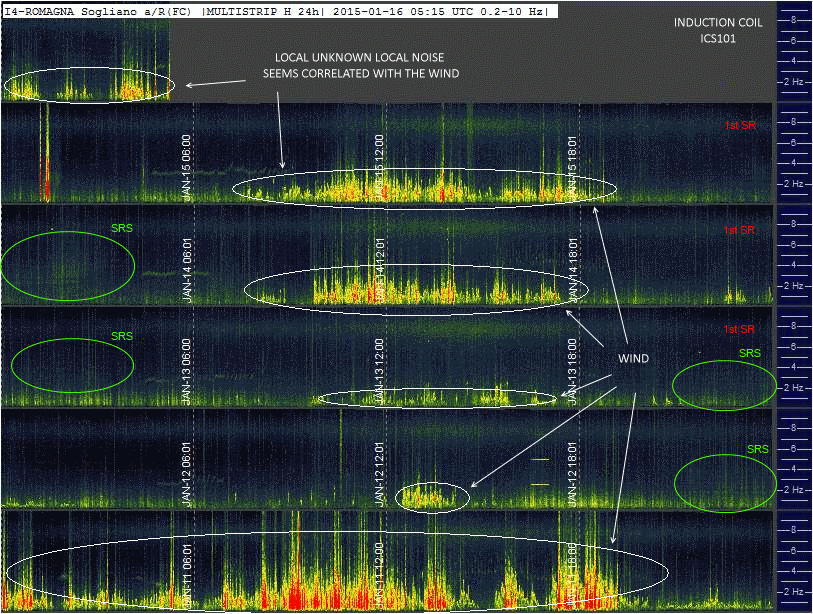 WIND(?) on INDUCTION COIL |
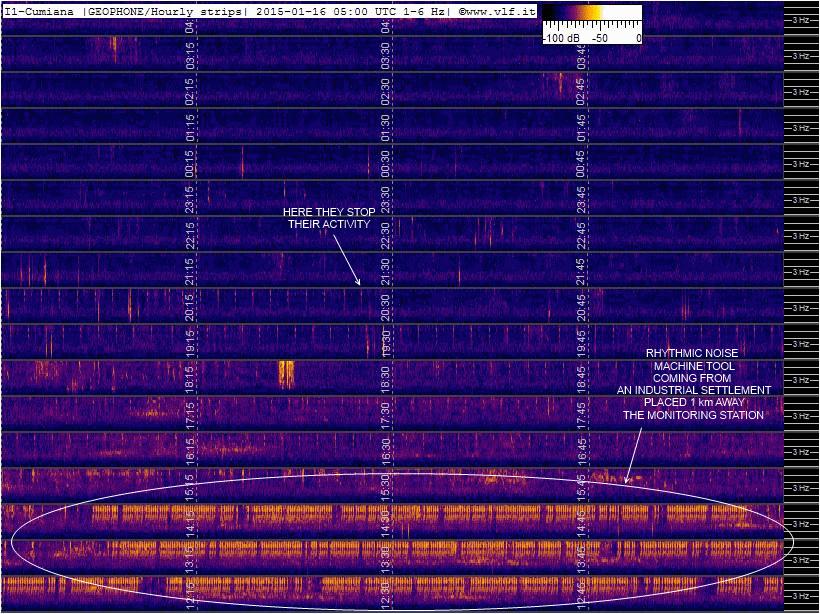 TOOLMACHINE on GEOPHONE |
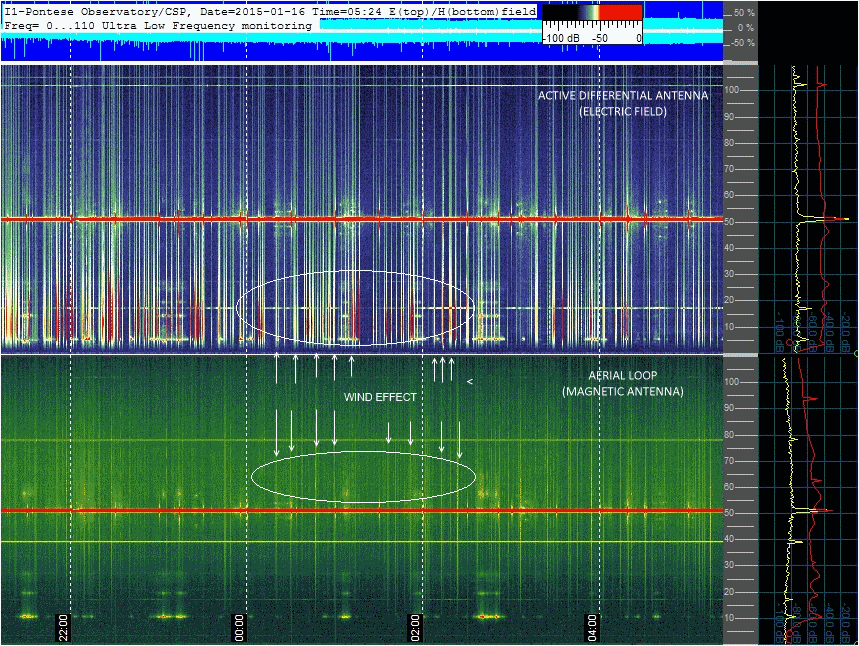 WIND on ADA and AERIAL LOOP |
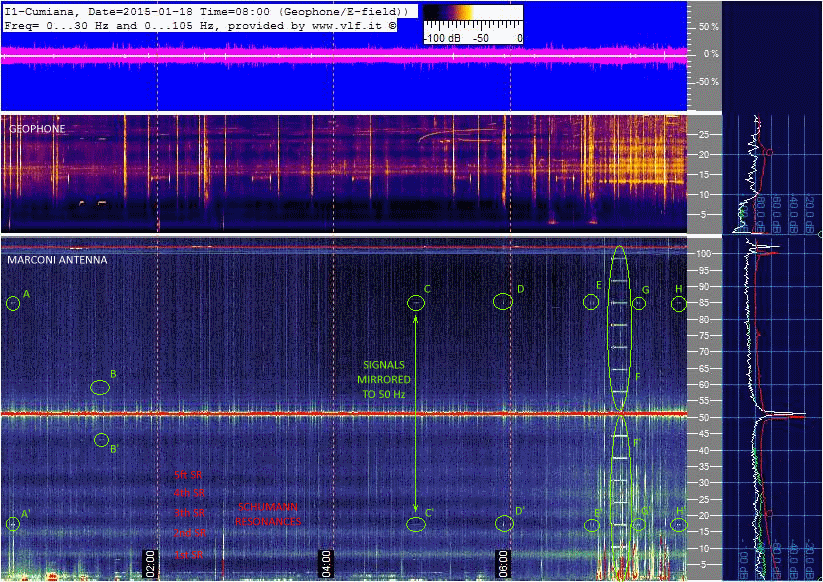 MIRRORED SIGNALS on MARCONI |
 TRAIN 5 km away from COILS |
 TRAIN/POWER LINE on COILS |
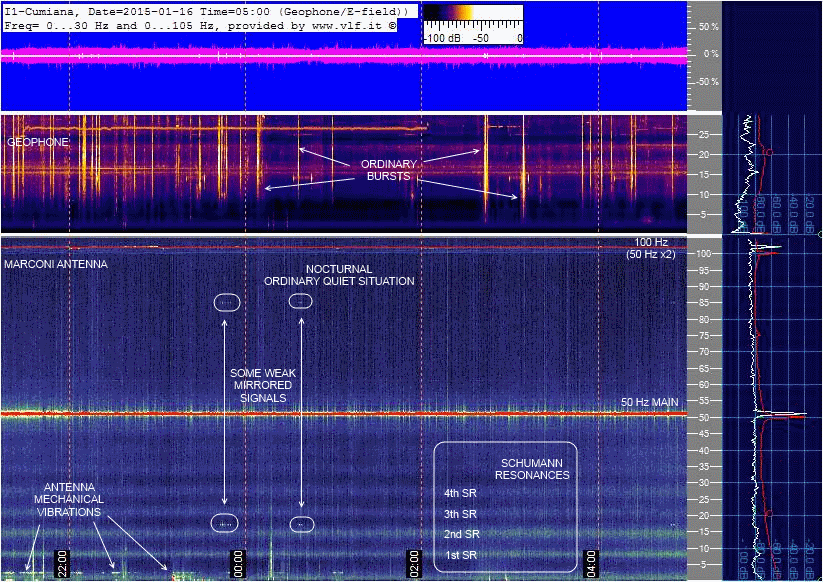 ORDINARY SITUATION MARCONI |
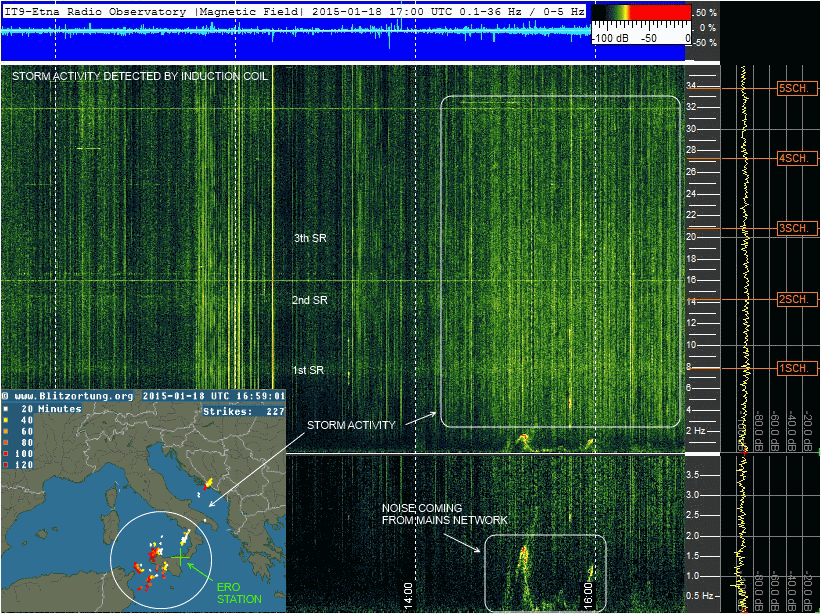 STORM on COIL |
|
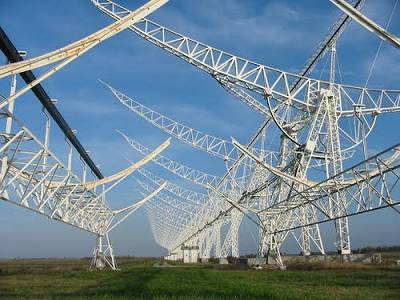
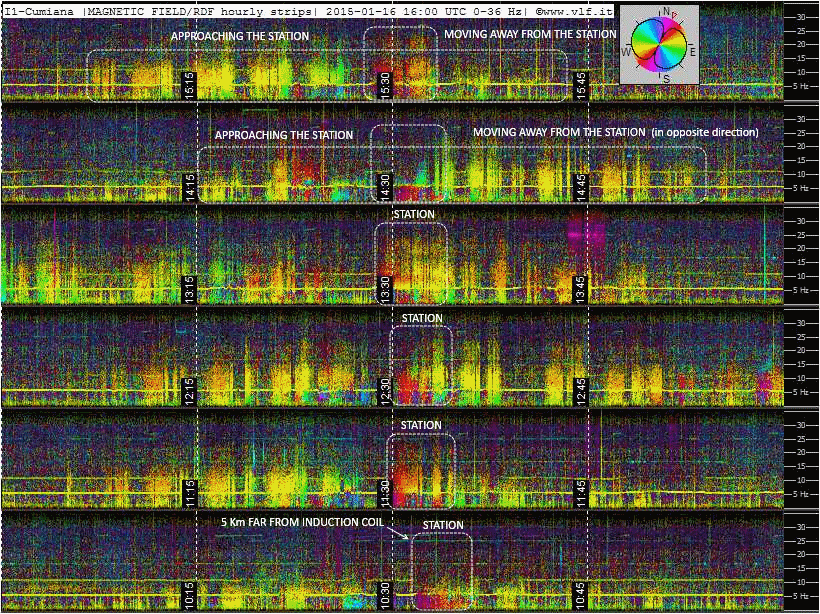
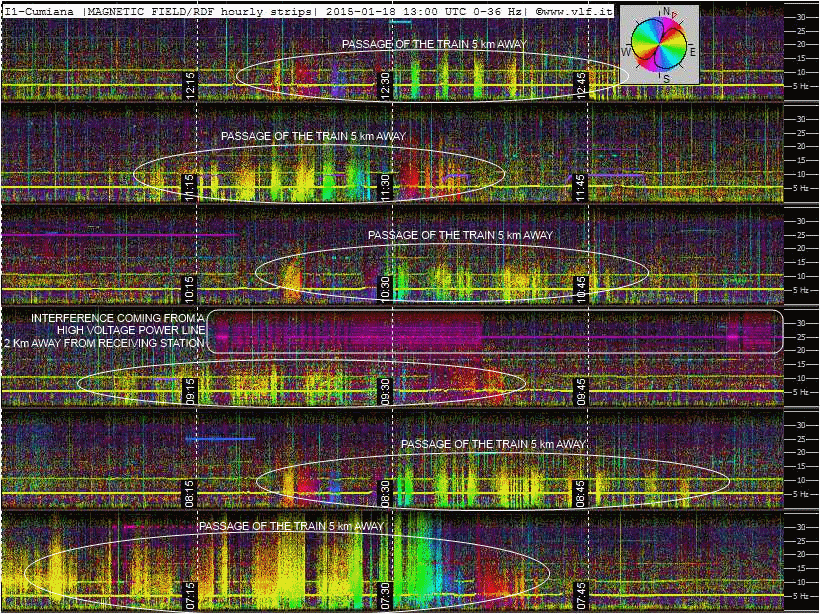
As we can see the variety of signals that a field sensor at very low frequency can collect is very mixed. Without the support of a prove experience in this topic many of these signals may be in good faith identified as precursors. The high-voltage lines they convey signals for dozens of kilometers from the origin point, which can be for example a factory. We can be in open country, kms away from a power line, and receive on our systems the noise coming from a factory situated 100 km away from our location. The same is true for trains and rail lines: during our measuring campaign we received signals from moving trains when they still were more than 10 kms away from our sensors.
One year of continuous monitoring has also led to a finding that the low-frequency electromagnetic pollution situation is slowly but steadily getting worse. A large part of the monitoring stations showed an increase in the presence of interference, despite their position relatively remote by activities and human settlements. To the already known low frequency noise of industrial origin did go to add up a new type, one of more domestic nature. There are in fact more and more VLF anthropogenic signals: they are present in a continuous manner (Eg from the WI-FI Powerline adapter devices) or at certain times of the day (Eg inverters for photovoltaic installations).
Unfortunately this, added to the noise present in a constant way like those originating from switching power supplies or power regulation systems (such as the dimmers of Halo or LED lamps) further reduces the operating margin for those ones working in unprofessional way. This also explains why the reception of the radio seismic precursors seems to be a daily reality within the reach of any amateur radio, but then, by these receptions, predictions never come. The picture of what we can get from a "home station" is much more complex than what we may naively assume at first sight.
ANALYSIS OF SEISMIC DATA
Opera 2015 has operated on the basis of 15532 earthquakes detected by Italian Institute of Geophysics and Volcanology, an average of 40 earthquakes per day, choosing for the study only those with magnitude greater than 3.2 , which have been around 279. On these 279 was applied the Radio Seismic Index Calculation described above, selecting the following 46 events with the highest probability of finding associated radio emission:
| EVENT |
DATE
TIME UTC |
WHERE |
MD |
RI
dBe |
| 041 |
2015-12-20
09:46:03 |
Sicilian Coast, Mid North (Palermo) | 4.2 |
-2.29 |
| 040 |
2015-12-08 10:53:55 | Etna volcano,
Sicily (earthquake + paroxysm) |
3.2 |
+8.95 |
| 2015-12-08
09:28:31 |
3.4 |
+12.94 | ||
| 039 |
2015-11-24 22:50:54 | Peru
Brazil border region (Land: Peru) |
7.6 |
-5.86 |
| 038 |
2015-11-20 05:12:24 | Costa Greca
Ionica (GRECIA) |
5.0 |
-5.56 |
| 2015-11-18 12:15:39 | 5.0 |
-6.21 |
||
| 2015-11-17 08:33:46 | 5.3 |
-1.31 |
||
| 2015-11-17 07:10:08 | 6.5 |
+16.62 |
||
| 037 |
2015-11-06
04:03:04 |
Italia/Francia boundary | 3.8 |
0.22 |
| 036 |
2015-11-01
07:52:03 |
Slovenia/Croazia boundary | 4.8 |
-3.95 |
| 035 |
2015-10-26
09:09:32 |
Hindu Kush province, Afghanistan | 7.5 |
+1.85 |
| 034 |
2015-10-20
10:35:50 |
Modena
province, North Italy |
3.5 |
-0.71 |
| 033 |
2015-09-20
22:27:58 |
Siracusa
coast, Sicily |
3.8 |
+0.87 |
| 032 |
2015-09-19 07:12:47 | Pesaro and Urbino area | 3.7 |
+8.27 |
| 2015-09-18 19:24:52 | 3.5 |
+5.50 |
||
| 031 |
2015-09-16 22:54:33 | Near coast of central Chile | 8.2 |
+1.02 |
| 030 |
2015-09-13 01:04:34 | Firenze
province |
3.8 |
-1.35 |
| 029 |
2015-09-10 07:32:08 | Torino
area, NW Italy |
3.1 |
+3.7 |
| 028 |
2015-08-29 18:47:03 | Slovenia-Italy boundary (SLOVENIA) | 4.0 |
-11.99 |
| 027 |
2015-08-24 03:43:54 | Forli'-Cesena Province, North Italy | 3.5 |
+5.27 |
| 026 |
2015-08-03
07:27:48 |
Cosenza area coast, South Italy | 4.0 |
-9.77 |
| 025 |
2015-08-02
06:58:06 |
Cosenza coast, South Italy | 4.0 |
-9.44 |
| 024 |
2015-07-22
12:57:43 |
Bologna
province |
3.7 |
-0.18 |
| 023 |
2015-06-09
21:49:49 |
Crete, Greece | 5.4 |
-10.09 |
| 022 |
2015-06-09
01:09:03 |
Greece | 5.1 |
-9.51 |
| 021 |
2015-05-30
11:23:02 |
Bonin Islands, Japan, region | 7.6 |
-6.58 |
| 020 |
2015-05-29
13:07:57 |
Adriatico_centro-sett.
N. Italy |
4.2 |
-6.46 |
| 019 |
2015-05-24
06:00:33 |
Aspromonte,
Calabria, South Italy |
3.9 |
-0.91 |
| 018 |
2015-05-12
07:05:20 |
Nepal |
7.3 |
-5.07 |
| 017 |
2015-04-25
06:11:26 |
Nepal |
7.7 |
+1.22 |
| 016 |
2015-04-24
15:02:54 |
Zona_Forli
N. Italy |
4.0 |
+13.00 |
| 015 |
2015-04-20
01:07:42 |
Etna |
3.6 |
+13.38 |
| 014 |
2015-04-16 18:07:43 | Crete, Greece | 6.4 |
+4.88 |
| 013 |
2015-04-11 05:33:13 | Alpi_Cozie
NW Italy |
3.2 |
-8.78 |
| 012 |
2015-04-01 04:58:11 | Appennino forlivese, North Italy | 3.2 |
+0.54 |
| 011 |
2015-03-29 23:48:30 | New Britain, Papua New Guinea, region | 7.6 |
-10.56 |
| 010 |
2015-03-29 10:48:46 | Calabria south cost - South Italy | 3.6 |
-7.91 |
| 009 |
2015-03-27 23:34:54 | Crete, Greece | 5.4 |
-9.72 |
| 008 | 2015-03-04 00:00:04 | Firenze, North Italy | 3.7 | -3.43 |
| 007 | 2015-02-15 19:42:53 | Appennino Bolognese, North Italy | 3.9 |
+10,77 |
| 006 | 2015-02-13 18:59:16 | Northern Mid-Atlantic Ridge | 6.8 |
-2.03 |
| 005 | 2015-02-06 08:52:25 | Lipari Islands, South Italy | 4.7 |
+8.23 |
| 004 | 2015-01-31 06:30:00 | Etna
volcano eruption, Sicily
sea (paroxysm) |
- |
- |
| 003 | 2015-01-28 15:54:37 | Crete, Greece | 5.2 |
-11.66 |
| 002 | 2015-01-23 06:51:20 | Appennino Pistoiese, Central Italy | 4.3 |
+5.93 |
| 001 | 2015-01-10 23:50:02 | South Italy, Sicily sea | 3.9 |
-13.06 |
| 000 | 2014-12-28 21:43:38 |
Calabria/Sicilia, South
Italy (episode zero, testing purpose) |
4.4 |
-4.15 |
Now that we have acquired events let's go in what is the main focus of our research: the hunt for radio seismic anomalies. We have seen before that ELF band is characterized by a typical background noise: the Schumann resonances, and is populated by a myriad of natural signals such as geomagnetic pulsations, SRS and electrostatic discharges close to of thunderstorms. If we add to these signals the various disturbances of human origin (industrial and domestic) we obtain the representation of a band populated by a large number of signals, different from each other in frequency, amplitude and duration. As we saw earlier we are therefore not in the realm of silence, looking for some strange noise that comes out from the background hiss, as in radio astronomy. Low frequencies are a pot boiling continuously for a variety of reasons: from natural causes (solar storms in time) to our activities where electricity is used everywhere for everything.
It is easy, in a situation so rich and confused of signals, to assign at some anomalies the validity of precursors
whereas they are not. A simple threshold representation, based on the amplitude of the received signal, used for example in many study systems of precursors many years ago, would automatically include thousands of signals. This is the reason because the FFT analysis is unavoidable: we need an intelligent and interpretative analysis, with an eye and a mind that recognizes the known FFT shapes and at the same time able to grasp anomalies, and recognize the alien element.
Once recognized the anomalies it is necessary to eliminate false alarms, also because not all of the received signals are traceable to their origin: many of them remain unexplained, but not for this may be seen as precursors. The one that we used has been the technique of crossed feedback, that is the verification that on stations were present some conditions so that it could be positive definite the detection of a precursor:
- the precursor signal received simultaneously from all stations with similar seismic radio index (RI)
- the comparison with the receptions of days before and after, to exclude the periodic signals
- a recognized precursor in an event, if it occurs in another situation, must be followed by an earthquake
- an earthquake that occurs for two times with the same Md in the same place must originate a similar precursor
We have identified many signals with bizarre shapes on FFT, very similar to the natural origin signals, in correspondence to earthquakes occurred in proximity of a monitoring station: they really are ideal candidates as precursors. The comparison of daily analyzes has revealed the recurrence of these signals, they occur with forms not always equal and matching, but at similar times
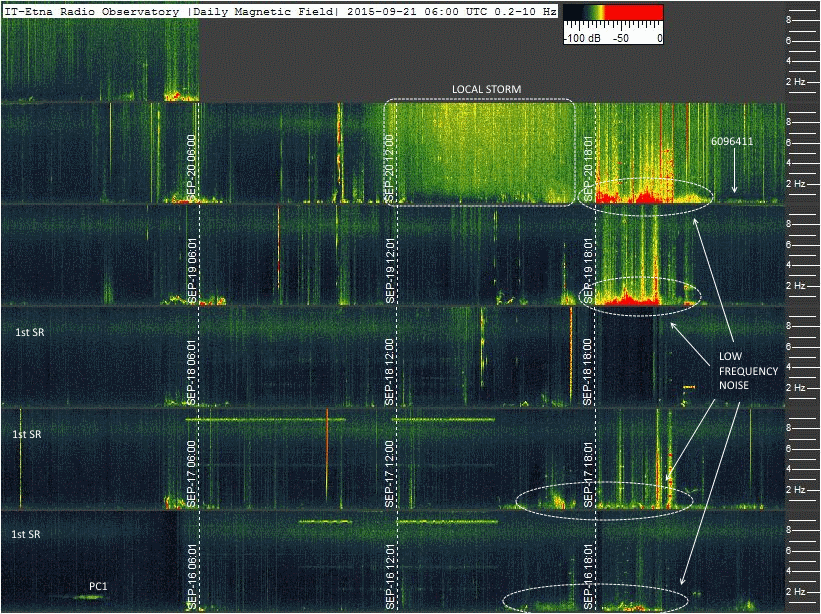
Here is a classic example where the seismic event (marked 6096411, Episode 033, 2015-09-20 22:27:58, Siracusa coast, Sicily, Md.3.8 ) is preceded by a widespread increase of the background noise in the previous 10 hours, and by a strong increase during the three hours preceding, then returns to normal levels after the earthquake. A cross-analysis with the data of lightning provided by Blitzortung and a comparison with the receptions of the previous days reveals that also in this case no precursor does exist.
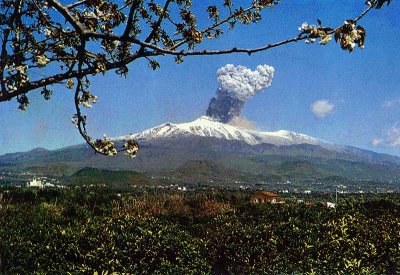
In our years of monitoring we have also been fortunate crossing two eruptions of Etna Volcano, and our recording devices are located a few kilometers from the volcano's vents. We followed the paroxysm since its inception: the geophone informing us constantly of the lava flow that went up from the depths of the earth to the surface, capturing the vibrations as a weak continuous earthquake that lasts tens of hours. Even in these two cases, however, the absence of very low frequency signals before and during the eruption, was clear: no abnormal signal, and no variation of those normally existing, as the Schumann resonances. The only signal detected the induction coil was the microphone effect, caused by the vibration sensor, and of which we know well the mechanism.
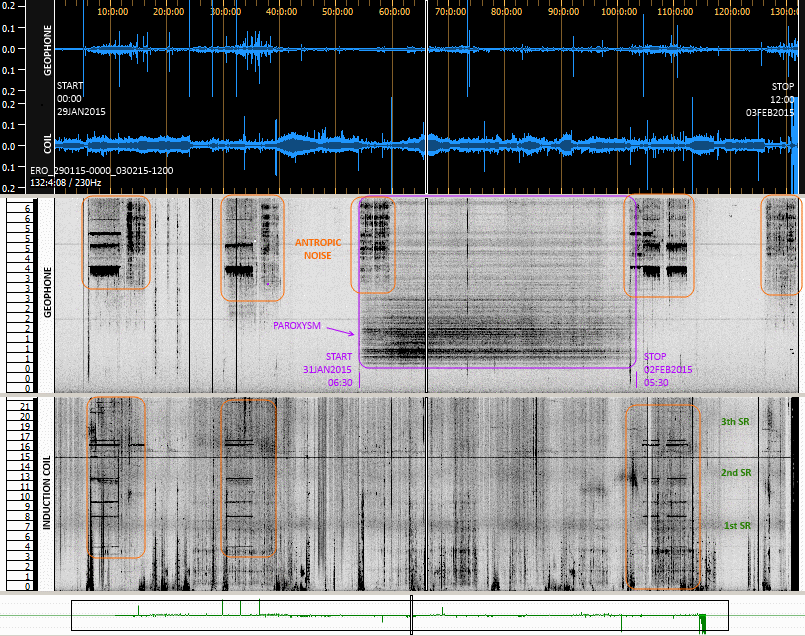
The
picture shows about 6 days of recording during an
eruption (episode 004,
2015-01-31 06:30:00, Etna volcano eruption). The
paroxysm track vibration is very clear on the
geophone spectrogram, while in the induction coil
spectrogram nothing appears in addition to
Schumann Resonances and anthropogenic noise,
easily recognizable. The same happens for 004
episode.
On our 46 events captured, depth and methodical analysis was conducted with crossed feedback on daily schedules, on the periodic recurrence of suspicious patterns, and the repetition of these patterns in other earthquakes. False local signals have been excluded which are a lot, even in magnetically quiet zones, and eliminating even the wind connected signals, storms and other natural phenomena known, we have not been able to join the presence of some strange radio signals to an earthquake.
In other words, although at first glance there are many acquisitions which suggest to be in front to a precursor, at the end of these verifications any signal is found to be in some way matched with seismic events, nor for events closest, neither for distant events. To synthesize, in unequivocal and repetitive way: "total absence of precursors" in all cases examined. But then, all the writings and research published until now who speak of precursors are all false? It 'clear that it is not so, let's see why.
ANALYSIS OF THE LITERATURE ON THE PHENOMENON
Let's see what the international literature shows. Then we will try to understand how our results contextualized with what so far is found: where they are in agreement and where they are rather disagree. In the introduction we mentioned many kind of precursors: we see below when and how they appear, and how they were detected by other researchers. The comments indicated on each paper only refer to the reception of ultra-low frequency electromagnetic signals received by ground stations. Many of these documents discuss also of observed data from satellites that here we don’t report because they are no matter on this study.
On each of these items we have applied the calculation of seismic radio index: the numbers in bold indicate the calculated values. The ones marked in red are those with values below +10 dBe.
Ultra-low frequency electromagnetic monitoring within PBO
Simon Klemperer (sklemp@stanford.edu), Tony Fraser-Smith, Greg Beroza, Darcy Karakelian
Stanford University
Ultra-low frequency (0.01-10 Hz) magnetic field anomalies prior to and following M > 6.5 earthquakes have been reported from a number of different regions of the world, but few have been sufficiently well-documented to be definitively confirmed or rejected. This is largely due to the absence of instrumentation in the zone of the impending earthquake: preceeding positive experiences suggest that they could be detected above noise level to a distance of about 100 km, for a ULF-EM station only in a quiet environment.
RI: +37.50 dBe
Annales Geophysicae, 23, 1335–1346, 2005 SRef-ID: 1432-0576/ag/2005-23-1335 © European Geosciences Union 2005
Anomalous effect in Schumann resonance phenomena observed in Japan, possibly associated with the Chi-chi earthquake in Taiwan.
M. Hayakawa, K. Ohta, A. P. Nickolaenko and Y. Ando
Anomalous SR behaviors observed from middle latitude (Japan) under Chi-chi earthquake, magnitude 7.6 , under one year studies (2'000 km away from epicenter) . Most of them present in the fourth resonance mode and founded to occur one day before the earthquake and it lasts for two days.
RI: +14.87 dBe
Are pre-seismic ULF electromagnetic emissions considered as a reliable diagnostics for earthquake prediction?
Abhishek Shrivastava, NIMS Institute of Engineering and Technology, NIMS University, Jaipur 303 121, India
On the one hand the occurrence of strong ULF magnetic field disturbances, several hours to several weeks prior to the main events, from 0.005 to 10 Hz, and up to 630 km from epicenter, reported. But, at the same time the needed to develop different methods of analysis, because real-time earthquake prediction consist of several problems and in many case they did not record any ULF emissions associated with some significant earthquakes.
RI: +40 dBe (more then this value in some example reported)
International Journal of Technology (2014) 3: 251-258 ISSN 2086-9614 © IJTech 2014
CHANGES OF THE GEOMAGNETIC SIGNALS LINKED TO TOHOKU EARTHQUAKE ON MARCH 11th 2011
Bulkis Kanata , Teti Zubaidah , Cipta Ramadhani , Budi Irmawati
Anomalous geomagnetic field variation the ULF frequency range of 0.001–0.016 Hz are recognized 2/3 weeks prior to the Tohoku earthquake (Japan) on March 11th 2011 (MD 9.0), using data coming three INTERMAGNET observatories placed 129, 177 and 373 km far away the epicenter.
RI: +71.68 dBe, +67.56 dBe, +57.84 dBe
PROCEEEDINGS OF ISAP2000, FUKUOKA, JAPAN
ULF emissions associated with earthquakes in Kyushu
Yoshikazu AKINAGA, Katsumi HATTORI, Masashi HAYAKAWA, Kiyohumi YUMOTO
In frequency between 0.005Hz and 0.03Hz anomalies preceding two moderate earthquake (Mj=6.5 and Mj=6.3) has been detected by Nagoya Univ. STE Lab. TARUMIZU Observatory with Fluxgate Magnetometer 1sec Sampling, 64 and 96 km far from the event (in comparison with the results of remote reference data observed at the geomagnetic conjugate point)
RI: +43.31 dBe and +39.53 dBe
Nat. Hazards Earth Syst. Sci., 14, 789–798, 2014
Ultra low frequency (ULF) electromagnetic anomalies associated with large earthquakes in Java Island, Indonesia by using wavelet transform and detrended fluctuation analysis
F. Febriani, P. Han, C. Yoshino, K. Hattori, B. Nurdiyanto, N. Effendi, I. Maulana, Suhardjono, and E. Gaffar
The largest EQ (for example MD 7.5 135 km away) could be preceded by ULF geomagnetic anomalies, detected in range of 0.01±0.003 Hz by analisys based on wavelet transform (WT) and detrended fluctuation analysis (DFA), applyed on the minimum energy of spectral density ratio analysis and using data only around local midnight (16:00–21:00 UT)
RI: up to +48.59 dBe
New Concepts in Global Tectonics Newsletter, no. 65, December, 2012. www.ncgt.org
INTERVALS OF PULSATION OF DIMINISHING PERIODS AND RADIO ANOMALIES FOUND BEFORE THE OCCURRENCE OF M6+ EARTHQUAKES
Valentino STRASER vstraser@ievpc.org Parma, Italy (pp. 35 to 46)
Radio anomalies with an increase in the geomagnetic background between 0.1 and 20Hz up to 10 nT and Intervals of Pulsations of Diminishing Periods at 665 mHz, are simultaneous and worldwide receivable. These Global Seismic Precursors, instrumentally detectable, anticipate and precede the occurrence of M6+ earthquakes by few hours.
RI: -39.1 dBe
GEOPHYSICAL RESEARCH LETTERS, VOL. 17, NO. 9, PAGES 1465-1468, AUGUST 1990
LOW-FREQUENCY MAGNETIC FIELD MEASUREMENTS NEAR THE EPICENTER OF THE Ms 7.1 LOMA PRIETA EARTHQUAKE
A. C. Fraser-Smith, A. Bernardi, P. R. McGill, M. E. Ladd, R. A. Helliwell, O. G. Villard, Jr.
Radio precursors detected for HQ Md 7.1 at about 7 km of distance, range 0.01 to 10 Hz. Narrowband signal appeared 5 weeks first in 0.05 to 0.2 Hz range , followed by whide band noise increasing strarted 12 day before and covering the entire monitored band, from 0.01 to 10 Hz. Then, one day before, a dip in noise background started in 0.2 -5 Hz, and finally three hours before the event an exceptional high level activity in 0.01 to 0.5 Hz.
RI: +81.14 dBe
Journal of Geodynamics 48 (2009) 68–74
Ultra-low-frequency (ULF) and total electron content (TEC) anomalies observed at Agra and their association with regional earthquakes
Vishal Chauhana, O.P. Singha, Vinod Kushwaha, Vikram Singha, Birbal Singhb
Unusual ULF bursts up to 30 Hz correlated very well with regional earthquakes (4.7=M=5.1) that occurred from 172 to 628 km of the observing station.
RI: -14.94 to +3.43 dBe
EMC'04/Sendai
ULF GEOMAGNEIC CHANGES ASSOCIATED WITH CRUSTAL ACTIVITITY
Katsumi Hattori, Masashi Hayakawa, Kiyohumi Yumoto, Toshiyasu Nagao, and Seiya Uyeda
Detected variations of polarization at 0.01Hz band for M 6.5 at 60 km distance 10 days before,
and for M 6.5 15 km away 5 days before
RI: +44.15 dBe and +62.22 dBe
J. Ind. Geophys. Union ( October 2007 )
Vol.11, No.4, pp.197-207
Ultra Low Frequency (ULF) amplitude anomalies associated with the recent Pakistan earthquake of 8 October, 2005
Vinod Kushwah, Vikram Singh and Birbal Singh
This study: Muzaffarabad Pakistan 08.10.05 M7.7 11 days 5 days 10 dd 908 from 2 to 23 Hz, and as citations:
Spitake Arminia 07.12.88 M6.9 3-5 days 4 h 6 dd140 Fraser-Smith et al.,1990
Loma Prita California 18.10.89 M7.1 12 days 3 h 15 dd7 Kopytenko et al.,1990
Guam Japan 08.08.93 M7.1 10-15 days 3 days 60 dd65 Hayakawa et al., 1993 (in 2009 refuted as false alarm)
RI: +26.75 dBe and as citation +39.11 dBe +81.14 dBe +52.11 dBe
EMC’14/Tokyo
Ultra-Low-Frequency Magnetic Field Depression for Three Huge Oceanic Earthquakes in Japan and in the Kurile Islands
Alexander Schekotov, Masashi Hayakawa
Range 0.03 to 0.05 Hz For two up to MD 8.3 800 km distance at the same time others two stations placed 1600 and 2500 away did not detect anything,
RI +37.4 dBe, and detecting anything for RI: +28.4 and +22.6 dBe
J. Math. Fund. Sci. Vol. 47, No. 1, 2015, 84-103
Anomalous ULF Emissions and Their Possible Association with the Strong Earthquakes in Sumatra, Indonesia, during 2007-2012
Suaidi Ahadi, Nanang Tyasbudi Puspito, Gunawan Ibrahim, Sarmoko Saroso, Kiyohumi Yumoto, Akimasa Yoshikawa & Muzli
Seismogenic activities identified by analyzing the variation of polarization ratio SZ/SH of the ground base magnetometer, below 0.1 Hz, distances from 79 to 424 km for earthquake betwen 6.4 to 7.8 Md, 8 to 28 day before events.
RI: +38.5, +30.9, +49.7, +38.2 dBe
Journal of Atmospheric and Solar-Terrestrial Physics 72 (2010) 1292–1298
Interpretation in terms of gyrotropic waves of Schumann-resonance-like line emissions observed at Nakatsugawa in possible association with nearby Japanese earthquakes
M. Hayakawa a,b,n, K. Ohta c, V.M. Sorokin d, A.K. Yaschenko d, J. Izutsu e, Y. Hobara b, A.P. Nickolaenko f
Anomalous SR phenomena and associated line emissions up to 21 Hz in first 3 Schumann resonances frequency range have been detected 1 and 3 days before two EQs 200 and 250 km far away. M 6.8 and 6.9
RI: +33.0 +34.5 +31.6 +30.1 dBe
ANNALS OF GEOPHYSICS, 55, 1, 2012; doi: 10.4401/ag-5260
Anomaly disturbances of the magnetic fields before the strong earthquake in Japan on March 11, 2011
Yuri A. Kopytenko1, Valery S. Ismaguilov1, Katsumi Hattori2, Masashi Hayakawa3
Differential anomalies in ultra-low frequency magnetic variations (F <10 Hz,clearest in the frequency range of 0.033 Hz to 0.01 Hz) from 3 years to 18 days prior an event with magnitude M 8.9. Distance 170/200/300 km and 420 km
RI: +66.58, +64.47, +59.18, +54.80 dBe
SOLAR WIND PROTON DENSITY INCREASE AND GEOMAGNETIC BACKGROUND ANOMALIES BEFORE STRONG M6+ EARTHQUAKES
V. Straser, G. Cataldi
The results of the study showed that all M6+ earthquakes that took place on a global scale between 2012 and 2013 were preceded by an increase in the natural electromagnetic background between <3Hz and ~10-15Hz, with average time of 9 hours before. Overall, 94% of the M6+ earthquakes studied occurred after the onset of a radio anomalies, an increase in the geomagnetic background, and subsequent normalisation; the remaining 6% during the increase itself. All this in synchronicity between ion density variations in the solar wind, recorded by the ACE satellite.
RI: down to -39 dBe
New Concepts in Global Tectonics Newsletter, no. 59, June, 2011. www.ncgt.org
RADIO WAVE ANOMALIES, ULF GEOMAGNETIC CHANGES AND VARIATIONS IN THE INTERPLANETARY MAGNETIC FIELD PRECEDING THE JAPANESE M9.0 EARTHQUAKE
V. STRASER
Event M9.0 - Tohoku, Japan - 2011 March 11 05:46:24 UTC, increase in the number of radio interferences measured with frequencies <10 Hz observed 9'768 km from epicenter, with strength up to 30 nT, 80 dB over the first Schumann resonance (*1). But assertion that it is possible to observe radio wave anomalies in the ELF band in conjunction with seismic activity with magnitude 6+ (*2) and in some cases even as low as +4 (*3), right across the globe.
*1 RI: +15.3 dBe (real value -74.7 dBe, considering the precursor strength), *2 RI: -39 dBe, *3 RI: up to -69 dBe
Indian Journal of Radio & Space Physics Vol 41, October 2012, pp 543-556
A search for precursors of earthquakes from multi-station ULF observations and TEC measurements in India
Vishal Chauhan, O. P. Singh, Uma Pandey, Birbal Singh, B. R. Arrora, Gautam Rawat, B. M. Pathan, A. K. Sinha, A. K. Sharma & A. V. Patil
Wenchuan (China) earthquake 12 May 2008 06:28:01.57 UTC, MD 7.9. The results of the analysis, performed with identical 3-component search coil magnetometers (f = 0.01-30 Hz). show between 2 and 5 days before occurrence of amplitude burst up to 30 Hz as precursors whose amplitudes, up to 3 nT, decrease with distance. Monitoring station of Shillong 1251 km, Guttu 2376 km, Agra 2496 km and Kolhapur 3368 km.
RI respectively: 25.58 dBe, 17.22 dBe, 16.58 dBe, 12.68 dBe (according to through cross-feedback precursors selection method used in Opera these signals would not be considered precursors)
PHYSICA A: STATISTICAL MECHANICS AND ITS APPLICATIONS · FEBRUARY 2016 Impact Factor: 1.73 · DOI: 10.1016/j.physa.2016.01.065
Intermittent criticality revealed in ULF magnetic fields prior to the 11 March 2011 Tohoku earthquake (Mw=9 )
Y. Contoyiannis, S. M. Potirakis, K. Eftaxias, M. Hayakawa, A. Schekotov
Ground-based measurements of ULF magnetic variations below 0.5 Hz, detected with fluxgate magnetometer and analyzed with the method of critical fluctuations (MCF) , was detected prior to the 11 March 2011 Tohoku earthquake (EQ) EQ ( MW 9 ) a few days to one week before. But only the ULF data of geomagnetic observatory nearest to the epicenter of the EQ (~250 km far away) , presented criticality. No indications of criticality were obtained from analysis coming from the other ones 850 km and 1.200 km far away.
RI 63.06 dBe with positive response, RI 47.11 dBe and 42.62 dBe with any evidence
From almost all the examined articles highlighted a surprising uniformity of results, which indicate the presence of radio seismic precursors almost systematically only for RI with values higher of +30 dBe. Behind this condition it seems to exist a "middle ground", with values of RI between +30 and +10 dBe, where in some rare cases the precursors are detected. Finally dark areas, with lower RI to +10 dBe, where instead regularly nothing is detected.
With the calculating method of RI you get a coherence of results even from studies very different from each other, performed by different people, in different ways and in different times and places. The writings examined indicate different detecting ways which go from an increase in background noise at low frequencies, to the increase of Schumann resonances level. In several cases, a data analysis is performed using only the nocturnal part of the acquisitions, as daytime ones are suffering from a significant level of anthropogenic disturbances related human and industrial activity, as we have verified too, and in other cases interference have been removed manually before proceeding to data analysis.
Also very interesting is the fact that, in cases of multiple receptions of a precursor from multiple locations, its intensity has been shown to strongly decreasing with distance, in full accordance with the model simulated by the RI calculation. The hypothesis that a stronger earthquake will be preceded by stronger precursors, and that being close to the event offers more opportunities to detect the precursors, it is quite logical and is not coming to us at first. Hattori already (2004) found that the appearance of ULF electromagnetic anomalies prior to an EQ is related to its magnitude and the epicentral distance. He showed that the detectable distance, R, should be 0.025R <M -4.5, where M is the magnitude of an EQ.
R < (M -
4.5) x 40 or, in another
way: R < (M - 4.5) /
0.025
This formula leads to the similar results obtained with the seismic radio indices obtained with our method with RI of +45 dBe.
It's really very small the number of publications "out of the chorus" claiming the presence of precursors of the order of nT with global coverage for all major earthquakes of magnitude 6. They have had in some cases a greater media coverage, especially in hobby circles, and it is easy to see the reason why: with their conclusions they depict receiving radio seismic precursors affordable for everyone. Their results, although posted by authoritative publishers, however, are at odds with almost all the publications on the subject: unfortunately moving away from the point of origin of the earthquake intensity of precursors rapidly decreases (in accord with the theories of propagation known today) up to disappear just beyond a few hundreds of km for most of the earthquakes.
So, except for a few isolated exceptions that we had to give mention dutifully, the profile of a hypothetical precursor appears
delineated quite precisely: to be in condition to receive radio seismic precursors it takes very strong earthquakes and we must be very close to them. In this context the seismic radio index theory is confirmed as a valuable help, providing a reliable indication if is possible or not to receive some signals connected to an earthquake. Our measurement campaign, despite being performed in a highly seismic area, has not given in a year any events with seismic radio index greatest of +16.62 dBe. The total absence of signals or anomalies related to earthquakes is therefore in line with the results of works published up to now by most researchers.
THE KIND OF PRECURSOR THAT DOES NOT EXIST
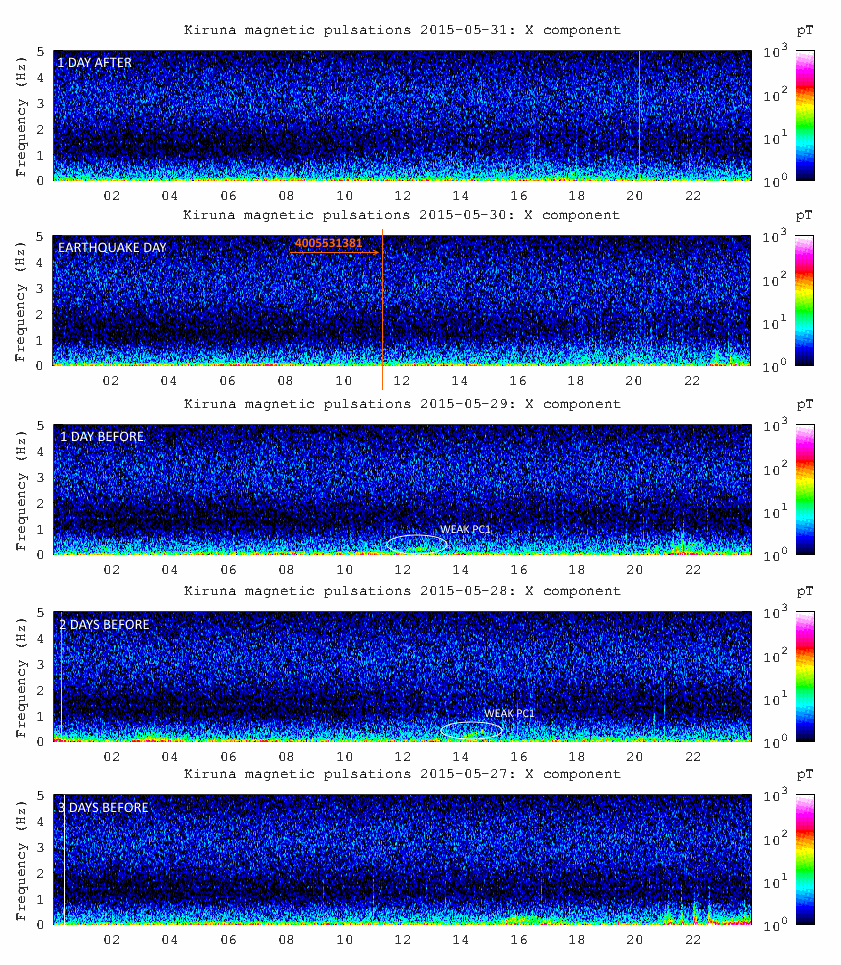
Going back one last time to the alleged global scale precursors: to confirm the absence of a global coverage radio precursors for all earthquakes of magnitude greater than 6 is also the analysis of data coming from other observers that we have taken as a reference for their reputation and reliability in the scientific environment. They are IRF and SGO observers. This is for example the analysis of the most intense earthquake occurred during the Opera 2015 campaign measures, with a magnitude of 8.2, realized using data of several days in a composite multi-image:
Opera event n. 031, 2015-09-16 22:54:33, Near coast of central Chile, Md 8.2, Ri: +1.02 dBe
http://www.irf.se/maggraphs/puls.php - Kiruna Geophysical Institute (Sweden )
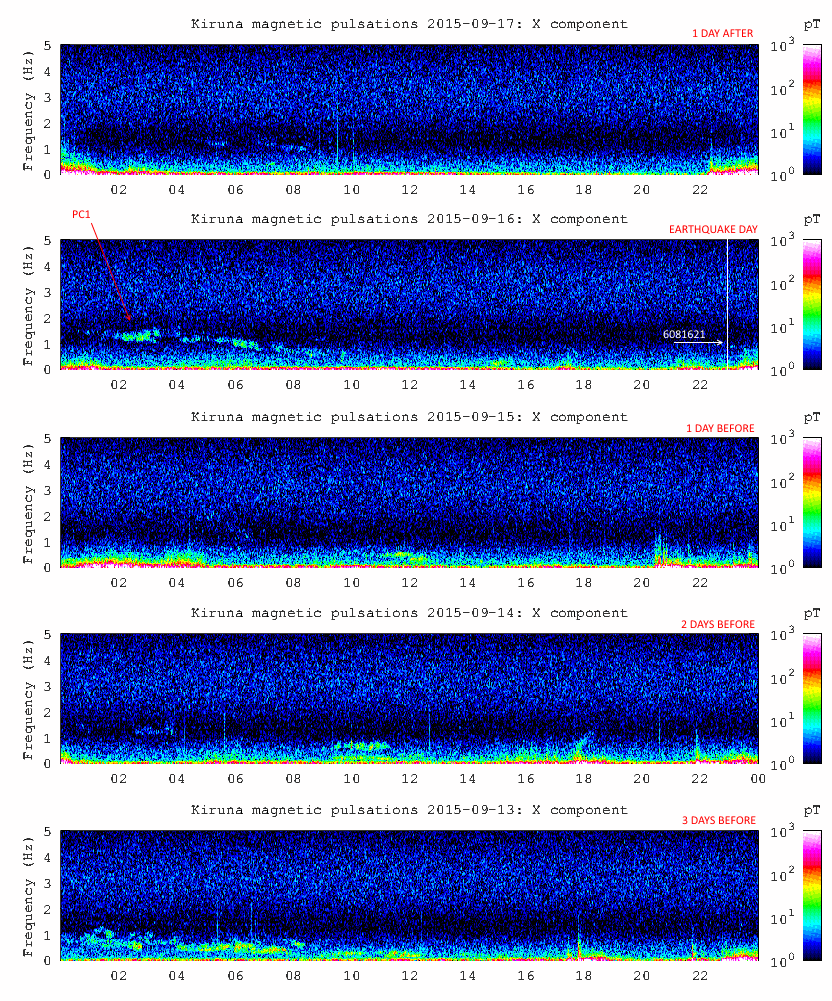
As previously described within our reports, comparing the day of the earthquake activity with the previous ones, it is clear that It does not highlight any abnormal activity. They are visible PC1 and the background noise at very low frequency, increases in the evening, as usually happens every day. It is clear that Kiruna observatory does not received emissions on a planetary scale, associated with the earthquake, at least on these frequencies. But let's see what happens in the another important observatory in Finland."
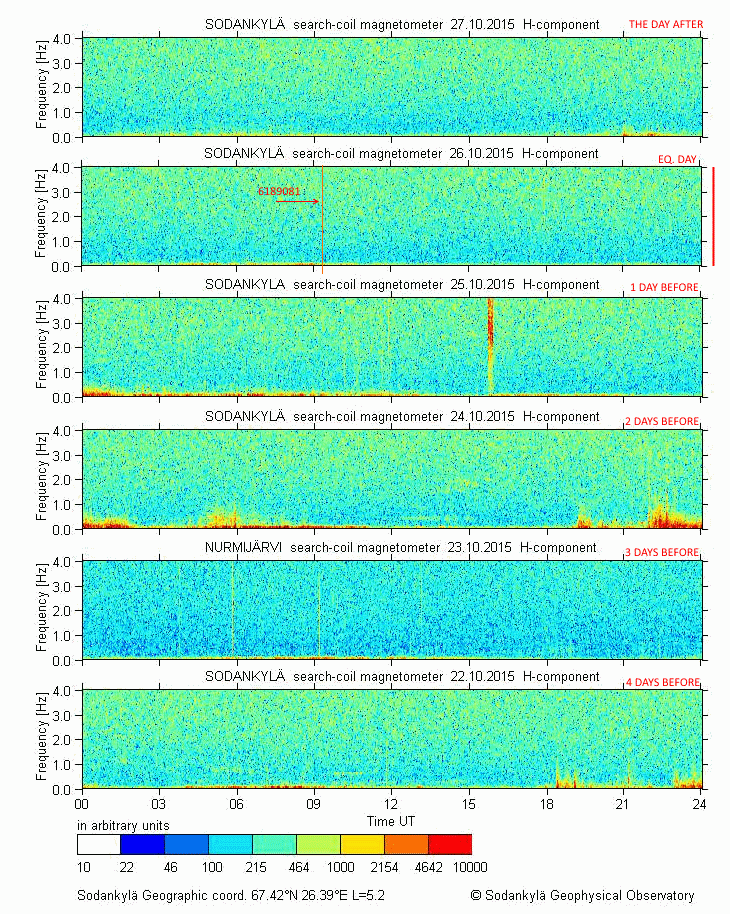
http://www.sgo.fi/Data/Pulsation/latestPulsation.php - Sodankyla Geophysical Observatory (Finland)
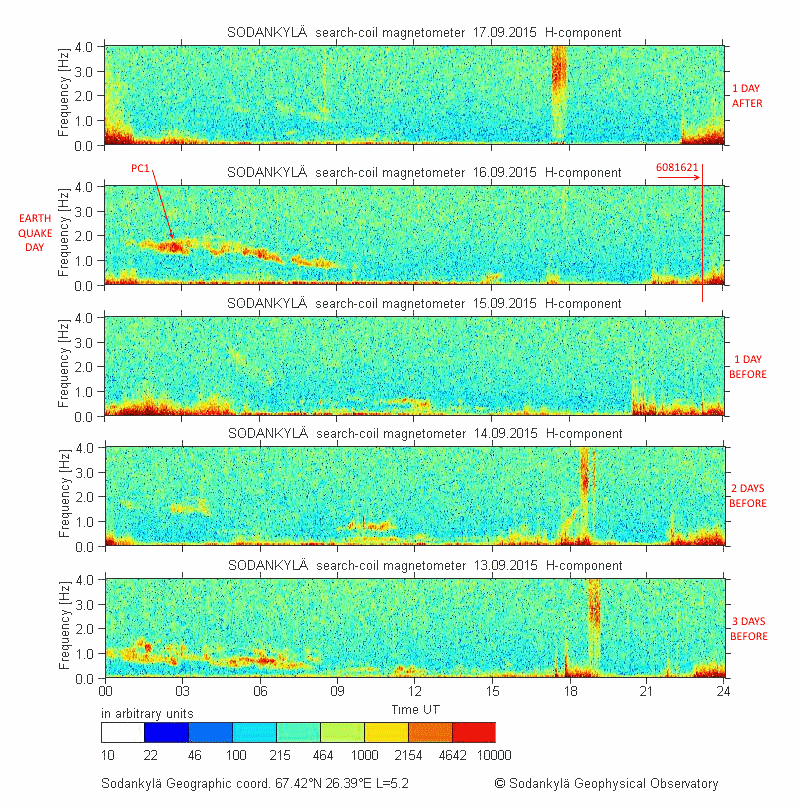
As in Kiruna, none of abnormal signal associated with the earthquake. If you do not know on what day happened the earthquake, looking at the spectrogram of the various days only, you are not able to establish any connection between earthquake and radio signals at these frequencies.
Same result with the
other four events with magnitude greater than 7.5
monitored during our campaign:
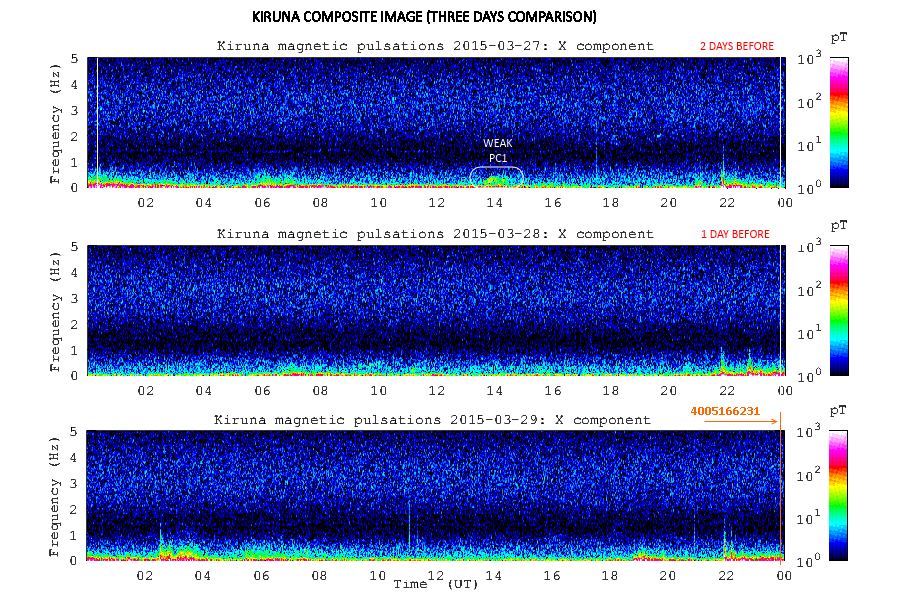
- Opera event n. 011 2015-03-29 23:48:30, New Britain, Papua New Guinea, Md 7.6, Ri: -10.56 dBe ---> 02.png
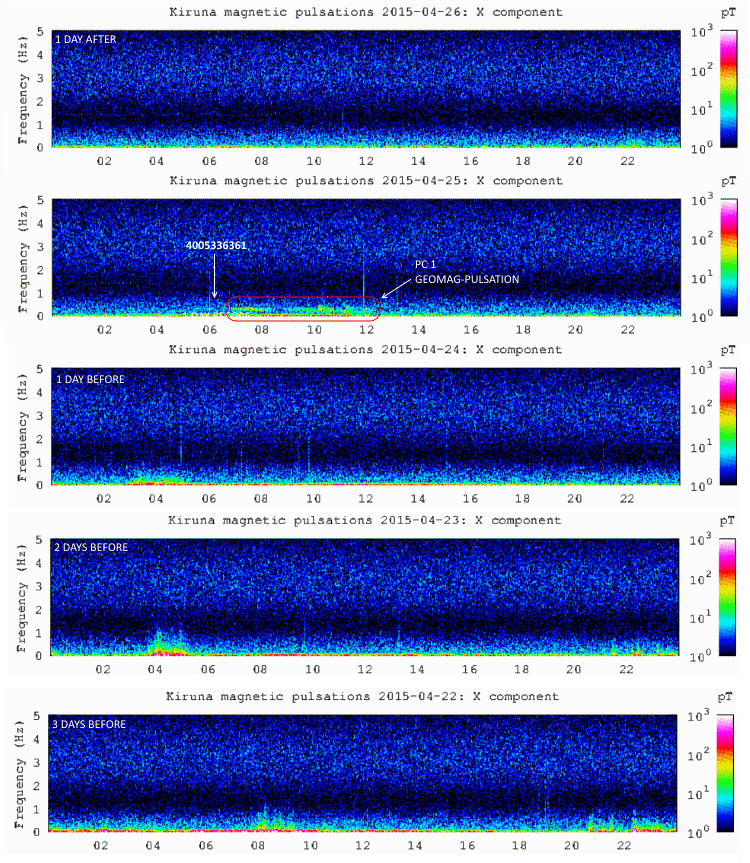
- Opera event n. 017 2015-04-25 06:11:26, Nepal, Md 7.7, Ri: +1.22 dBe ---> 03_kiruna-nepal.png
- Opera event n. 021 2015-05-30 11:23:02, Bonin Islands, Japan, Md 7.6, Ri: -6.58 dBe ---> 01b_Senzanome.png
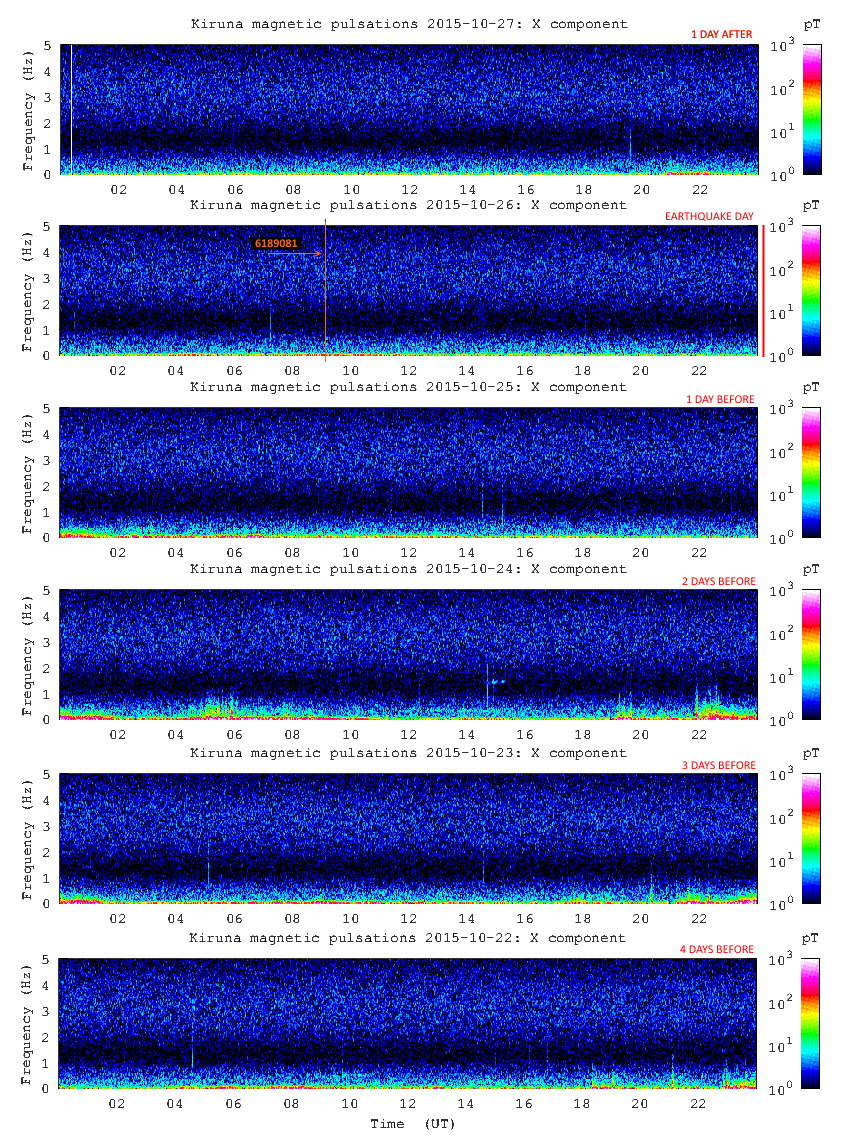
- Opera event n. 035 2015-10-26 09:09:32, Hindu Kush province, Afghanistan, Md 7.5, Ri: +1.85 dBe ---> 04_sort2.png and 05_composite2.png
Finally, we repeated
the analysis also on events of magnitude greater than
7.5 in previous years, chosen at random, always
obtaining the same result. We reiterate that this does
not invalidate the previous work done on this issue, or
at least most of them. However, it highlights that the
precursor to a global scale for earthquakes greater than
6 Md intensity of tens of nT (unfortunately) does not
exist.
Signals received with an intensity of tens of nT as indicated, if generated in the opposite part of the globe, according the propagation law seen before, would involve fields of in the order of 100 µT (!) in the area close the earthquake: we know that this does not happen. And more, 10 Hz signals with intensity of few tens of nT would exceed of 9 orders of magnitude in power what is the natural background level, made by Schumann resonances, sending into saturation, most of the monitoring stations on these frequencies: we know that even this does not happen, and the examples above confirm it.
RESULTS DISCUSSION
In OPERA campaign we have not selected seismic events in conjunction with strange radio signals detected: this is a way to produce misleading data that lead to false conclusions. We selected the strongest earthquakes in accordance with the calculation of a seismic radio index which meets the known rules of the propagation of radio signals, and we check whether in conjunction with them there has been (or not) a signal emitted. This overturns the technical point of view that is instead used in many science journalism, where a single, isolated, event is considered as an example and became a rule.
We, as well as the authors of many papers that we read, consider this approach essential for a serious research, otherwise cause and effect could be exchanged maybe coming to the conclusion that the moon rises in the sky because dogs start to bark. And this, with regard to newspaper reports, for radio seismic precursors has been done many times! As part of this transparency policy, we have made public all the data from our measurement campaign: it is perhaps the first time that a research project on seismic precursors radio provides not only the conclusions, and not only charts and spectrograms automatically processed in a year of observations, but also the source file with the original recordings, to give a way to reprocess the data and the opportunity of putting into question the results published. This is a completely transparent operation.
Our measurement campaign worked on the basis of data coming from 14 data sensors, positioned in 6 different locations in a highly seismic area, active 24 hours a day, for a total of more than 110'000 recording hours in a year. In this year of observations they did not detect any precursor. We initially questioned the sense of publishing negative results, but then we have given ourselves an answer: the negative results in the area of seismic radios are as important as the positive ones because they help to define the measurement context. If the publications on a topic are made only in the case of positive results, we get a distorted view of reality, leading to believe that seismic precursors radio can be picked up in all places and that therefore it is within our reach the possibility of using them to make predictions: it has happened many times and continues to happen.
Back to the signals, it is clear that alterations of existing signals or the signals of new origination, by compression in the layers of soil below are a reality, widely documented, but this actually only happens in very particular situations, in specified conditions. As already indicated Hattory in his theory, the detectable distance of ULF anomaly preceding the EQ with around 7.0 magnitude is about 100 km. Calculated with our index seismic radio method, which deepens and develops this calculation, it corresponds to an RI value of +45 dBe. In the examined paper the detection threshold under which it is not possible to detect precursors seems to be around +30 dBe. These thresholds indicates that the conditions in which we begin to have chances to receive radio seismic precursors are very rare, and are summarized in this table:
| MAGNITUDE (ML) |
RI +45 dBe, good opportunity to
detect radio precursors |
RI +30 dBe, radio precursors
threshold |
| 4 |
within
3 km |
within 10 km |
| 5 |
within 10 km | within 31 km |
| 6 |
within 31 km | within 100 km |
| 7 |
within 100 km | within 315 km |
| 8 |
within 315 km | within 1000 km |
To integrate this data we can add a last interesting consideration: it is well known that the size of the fault of a quake is proportional to its magnitude: more intense is the earthquake and greater is the crack that originated it. The relationship between the magnitude and size of the fault breakage is calculable only loosely: the variables that influence the calculation are varied, such as the composition of soil and rocks, the layout of the fault, but the size can be estimated anyway. Calculated according to the formulas of Coburn et al. 1987 on data reported in Italy it is:
log L
[km]= 0.677*ML - 3.143
| Therefore, in the case of the previous table data, they correspond to:
|
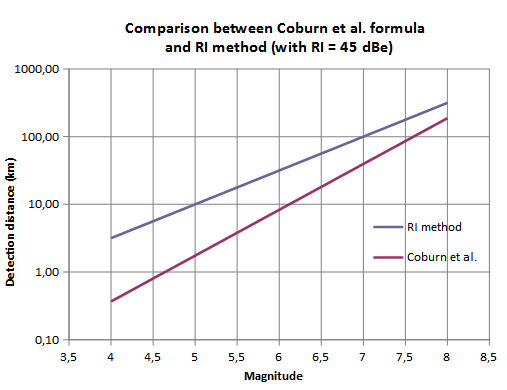 |
As we can see, there is a surprising correspondence between the distance defined by RI (in order to have good opportunity to detect radio precursors) and the size of the crack. In practice, though not identical, they fall within the same order of magnitude. We easily can conclude that, in order to receive the radio seismic precursors we need to have a high index seismic radio and this corresponds to be above or in the immediate nearby of the crack from which will originate the earthquake. This is in perfect agreement with the calculations already performed at the base of the RI development. This is yet another confirmation that the area where you can receive the precursors around the earthquake is very, very narrow.
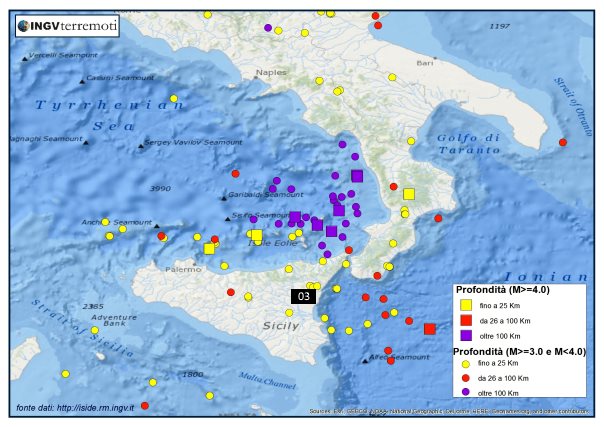
2015 earthquakes with
magnitude and deep: detail of Sicily area, around
our "03" monitoring station, showing our "strategic"
position.
The next picture is a summary graph, where we can see, according to our Radio Seismic Index, the possibility to detect a seismic radio precursor radio, based on the magnitude and the distance from it. The area is divided into green, greay and black zone. In green zone, with seismic radio index greater than +30 dBe, there is the possibility to detect radio seismic precursors, the grey area from +30 and +10 dBe represents a border area with rare possible detections, and where the indications of the documents are controversial. Finally, the black zone represents the condition where the possibility to detect precursors approaches zero.
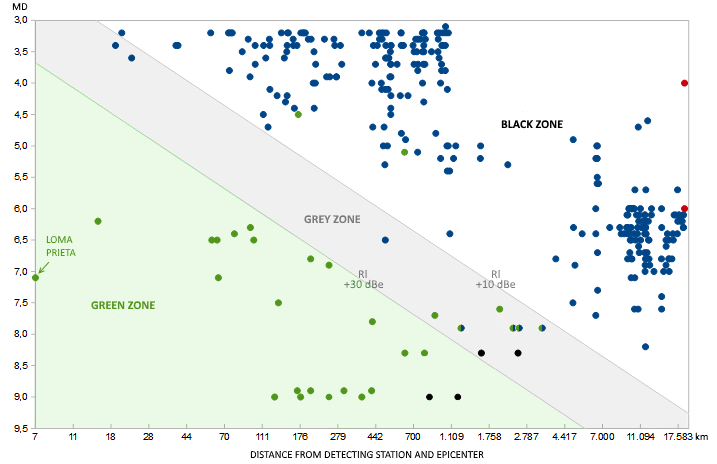
Green
balls are events documented in the papers that we
have taken as reference (see ANALYSIS OF THE
LITERATURE ON THE PHENOMENON above), while black
ones are negative feedback always from the
same source. Green arrow point the Loma Prieta
episode, placed in full green zone.
Green/blue balls are events that, according to
through cross-feedback precursors selection method
used in Opera, would not be considered with
positive response. Red balls are relative to those
writings who report presence of seismic radio
precursors on the whole planet, for earthquakes of
magnitude 4 or 6: the possibility to detect
precursors under these conditions, according to
this chart, it is not unlikely, but impossible.
Finally: blue balls are seismic events "seen" by
Etna volcano monitoring station during Opera 2015
measuring campaign, all with negative results. The
Etna Volcano location is one of six stations that
have recorded data, but the same graph created
with data from the other 5 stations shows
practically the same scene.
As we can see, despite the South Italy is a high seismicity zone, not even an episode falls into the minimum distance/intensity factor to be in a condition to receive precursors. After all, the main episode in which most of the articles on seismic precursors radio refers, is on the Loma Prieta earthquake in 1990, signed by AC Fraser-Smith, A. Bernardi, PR McGill, ME Ladd, RA Helliwell , OG Villard, Jr. We may consider it, with no doubts, the father of radio seismic research. Well, the radio seismic index calculated on this event even exceeds +80 dBe (!) and the monitoring station was positioned 7 km away from the epicenter, on a calculated fault line 40 km long: exactly above the break line.
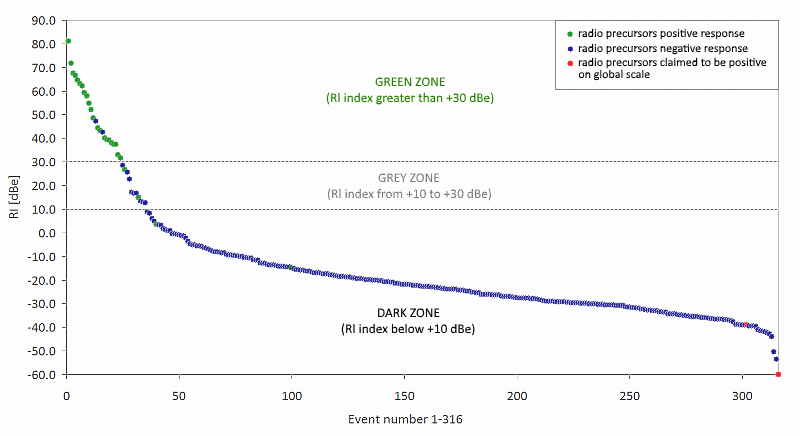
The same 316
events: 280 coming from the Opera Etna Volcano
recordings and 36 by consulted scientific paper. Here
magnitude and distance are removed: events are simply
sorted by RI seismic radio index. It's clear that
positive results are almost exclusively located in the
green area, therefore for RI value greater than +30
dBe. The grey area, with RI from +30 to +10 dBe, shows
controversial and questionable results. While the dark
areas, with RI below +10 dBe, is characterized almost
all by negative seismic radio feedback. The few
writings about (unlikely) events with global coverage
are indeed placed to the lower limit of the dark area.
The radio seismic index is confirmed to be a
determining factor to establish the possibility of a
seismic radio detection.
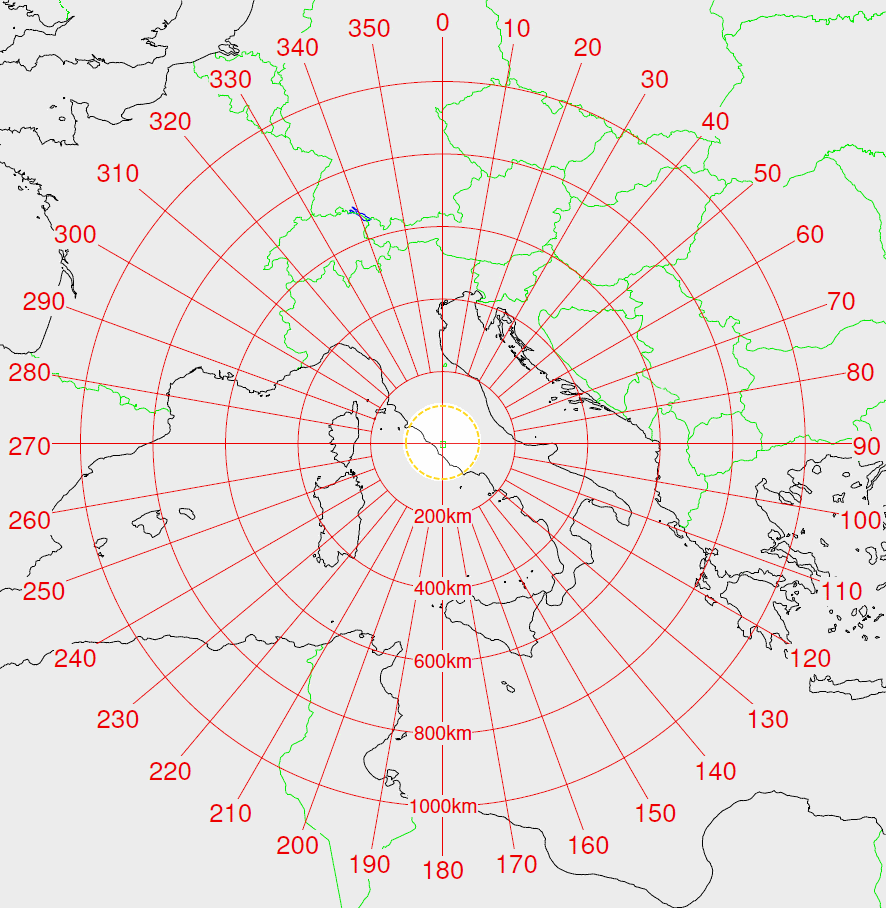 In
accordance with our hypothesis, hypothetical
receiving area of seismic precursors radio
(light space in the middle of the map) for an
earthquake Md. 6 supposed to happen in
geographic coordinates of Rome city, in
central Italy. The evidenced area, despite the
medium intensity of the earthquake, remains
very circumscribed.
|
There is one
last element that should be considered, and it is
related to the conditions in which certain
precursors were detected. In the previous analyzed
paper, besides the condition of a seismic radio
index greater than +30 dBe, was necessary in many
cases others requirements: to select receptions
only at night, to filter acquisitions by local
anthropogenic signals, to remove manually signals
recognized for sure as interference, to exclude by
acquisitions the (quasi) global coverage
geomagnetic signals of natural origin. The
condition of elevated seismic radio indices, so
does not guarantee the presence of strong signal
precursors: unfortunately we always are in
the presence of weak signals, difficult to
distinguish from natural and anthropogenic
background noise, always present, and as we saw in
the strangest forms. This also explains why in a year of monitoring, although the stations were equipped with highly sensitive devices, and placed in strategic locations, we have not detected any signal corresponding to earthquakes: it never happened those minimum conditions of seismic radio index we just mentioned. |
Perhaps the precursors are also present in our records but, if our assumptions are correct, they are buried under dozens and dozens of dB of other signals, impossible to detect. From this we can also reasonably assume that it is unthinkable to perform seismic monitoring radio, hosting a monitoring station in the house: low sensitivity amateur systems, with sensors like loops places even inside homes or condominiums full of noise sources, can be a useful technical /educational exercise for the low frequency exploration, but they have not, unfortunately, no chance to receive precursors. It is like to install a telescope under the street lamps: when someone, who works with a home sensor, connect the reception of a strange signal with an earthquake of MD 4 occurred on the other side of the world ... it may be in good faith, but he is almost certainly out of the way.
CONCLUSIONS
The OPERA_2015 results are contextualized perfectly with most of the studies so far published on the subject. To summarize the main points of this theme we can say that:
• more strong is the earthquake, and stronger will be the precursor
• the level of seismic radio precursors decreases rapidly with the distance
• a seismic radio index (like the one defined in OPERA) is a useful means of establishing the possibility to intercept the precursors, assigning a weight to each event: to study all the earthquakes on a global scale is useless
• the minimum condition necessary for the detection of a precursor, using our method, comes with an RI of at least +30 dBe
• for the reason stated above, technically they can not be detected seismic radio precursors on global coverage, even for medium intensity earthquakes with Md up to 6
• a monitoring station located in an urban area or home it has almost no chance to detect precursors of nature that we talked about
• it is very unlikely, in the light of these considerations, that the prediction of earthquakes could be just around the corner
From this statement it is also quite clear why, although for years they shouts from different parts "wolf, wolf", today a method to predict earthquakes does not exist yet. Our work summarized perhaps for the first time so clearly, the limits of the measurement methods at our disposal. The desire to save lives on the one hand, and the lack of contextualization of the data collected on the other, it has in the past, in good faith, led probably to be confident exceedingly on the development of a seismic radio method for earthquake prediction. The numbers that we know well today, thanks to the availability on-line measurements in real time, probably suggest to be a little less optimistic.
Is this paper, therefore, a tombstone on seismic precursors radio? Absolutely not, but it suggest a more down-to-earth approach, for a cross-check of causes and effects, comparing with measurement data: a re-positioning of the starting point, directing research towards the most productive sectors without fear to discard investigative solutions that, already only for the laws of physics, can not lead to any result. Avoiding wasting energy chasing the ghosts that do not exist, to steer research in an effective way, on this very interested and at the same time controversial topic.
SCIENTIFIC PUBLICATIONS ON THE DATA FROM THIS PROJECT
Romero, R.; Feletti, L.; Re, C.; Mariscotti, A.
Opera 2015 Project: Accurate Measurement Equipment for Earthquake Electromagnetic Emissions and Radio Seismic Indicator.
Sensors 2023, 23, 2379.
https://doi.org/10.3390/s23052379
Mariscotti, A.; Romero, R.
New radio-seismic indicator for ELF seismic precursors detectability.
The Egyptian Journal of Remote Sensing and Space Sciences Volume 28, Issue 1, March 2025, Pages 12-20
https://www.sciencedirect.com/science/article/pii/S1110982324000723
MANY THANKS TO:
- Istituto Nazionale di Geofisica e Vulcanologia (Italy) for earthquake data, http://cnt.rm.ingv.it/
- Istituto Nazionale di Geofisica e Vulcanologia (Catania, Italy) for paroxysme activity http://www.ct.ingv.it/it/tremore-vulcanico.html
- U.S. Geological Survey (US) for earthquake data http://earthquake.usgs.gov/earthquakes/
- Kiruna Geophysical Institute (Sweden ) for geomagnetic monitoring http://www.irf.se/maggraphs/puls.php
- Sodankyla Geophysical Observatory (Finland) for geomagnetic monitoring http://www.sgo.fi/Data/Pulsation/latestPulsation.php
- CSP - Innovazione nelle ICT, for scientific, computer support, and monitorig station http://www.csp.it/?lang=en
- INAF - Istituto di RadioAstronomia, for scientific support and monitoring station http://www.ira.inaf.it/Home.html
- Blitzortung, lightning localization network, http://www.blitzortung.org/
- Wolfang Buscher, author of SpectrumLab (Germany), software active on ours monitoring stations, http://www.qsl.net/dl4yhf/
- Dr. Jordan Palamos and Dr. Robert Schofield, Department of Physics, University of Oregon, for LIGO Collaboration
- Google map service, for seismic localization https://maps.google.com/
- National Oceanic and Atmospheric Administration, for Notifications Timeline http://www.swpc.noaa.gov/products/notifications-timeline
- TeamViewer, software for remote service connection, https://www.teamviewer.com
- Sonic Visualizer, program for viewing and analysing audio file, http://www.sonicvisualiser.org/
- Luca Feletti
for Seismic radio Index developing (RI)
- Luca Seoli for
RI web calculator version and web support
- Roberto Borri and Claudio Re for Pontese monitoring station
- Rosario Catania, Alessandro Longo and Salvo Caffo for Etna Volcano monitoring station
- Federico Scremin for Romagna monitoring station
- Jader Monari, Massimo Silvestri, and Renzo Cabassi for IRA monitoring station
- Claudio Re for
thechnical support and Torino monitoring station
- Fabrizio Francione for Torino monitoring station
- Andrea Bertocchi for the grammar document review
Return to www.vlf.it
This website and its pages do not incorporate profiling cookies, but only technical ones, used to allow the correct counter working (Shinystat only)